All Posts By

Lumovest

3C in Marketing

By Management & Strategy No Comments

What is 3C in Marketing?

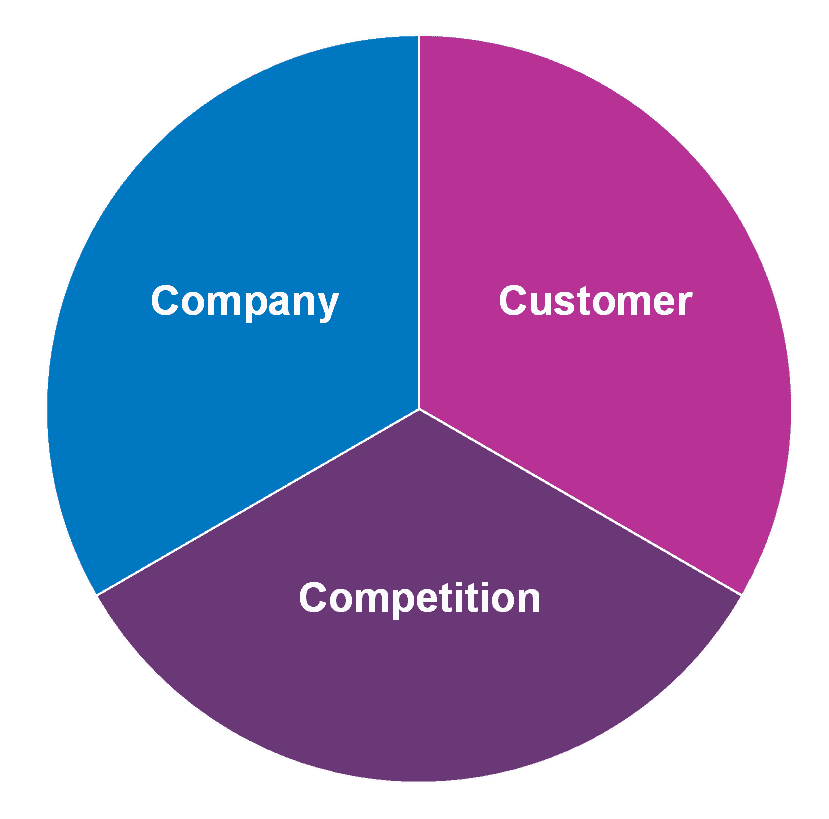
The 3C in marketing refers to the three key elements that businesses must consider when developing a marketing plan. The 3Cs are: company, customer, and competition. 3C is a very powerful marketing framework, along with the 4P in marketing.

The concept of the 3Cs was first introduced in the 1960s by Harvard Business School professor, Kenichi Ohmae. The idea was to provide a simple framework for businesses to analyze their marketing strategies and make informed decisions.

The first “C” in the 3Cs stands for “company”. This refers to the internal factors that affect a company’s marketing strategy, such as its strengths, weaknesses, resources, and capabilities. By examining its internal environment, a company can identify its unique value proposition and create a marketing plan that aligns with its overall goals and objectives.

The second “C” stands for “customer”. This refers to the external factors that affect a company’s marketing strategy, such as customer needs, wants, and preferences. By understanding its target market and their needs, a company can create a product or service that meets their needs and desires.

The third “C” stands for “competition”. This refers to the external factors that affect a company’s marketing strategy, such as competitors’ strengths and weaknesses, market share, and pricing strategies. By analyzing the competitive landscape, a company can identify opportunities and threats and develop a marketing plan that differentiates itself from its competitors.

The 3Cs are used by businesses to develop a marketing strategy that is tailored to its unique internal and external environment. In the rest of this article, we’ll learn about the 3Cs of marketing in greater detail.

3C in MarketingCompany

In the context of the 3C marketing model, “company” refers to the internal factors that affect a business’s ability to compete.

This includes the company’s mission, culture, strengths, and weaknesses. A thorough analysis of these internal factors can help a company identify its competitive advantages and limitations.

To conduct a company analysis, start by examining the company’s mission statement and values. This will help you understand the company’s goals and the principles it operates under.

Next, evaluate the company’s strengths and weaknesses. Strengths may include a talented workforce, a strong brand reputation, or proprietary technology. Weaknesses may include a lack of resources, poor management, or outdated technology.

It’s important to be honest in your evaluation and to focus on areas where the company can improve. By identifying weaknesses, a company can develop strategies to address them and become more competitive.

Additionally, consider the company’s culture and how it affects its ability to compete. Does the company prioritize innovation and risk-taking? Or does it prefer to stick to tried-and-true methods? Understanding the company’s culture can help identify areas where changes may need to be made.

Finally, look at the company’s financial performance and market position. Is the company profitable and financially stable? How does it compare to its competitors in terms of market share?

Overall, analyzing the company in the 3C model provides insight into its internal strengths and weaknesses, as well as its overall competitive position. This information can then be used to develop effective marketing strategies that capitalize on the company’s strengths and mitigate its weaknesses.

Customer

In the context of the 3C marketing model, “customer” refers to the target market that a company is trying to serve. The customer is the ultimate focus of any marketing strategy, as the success of the company is dependent on meeting the needs and wants of its customers.

Understanding the customer is a critical aspect of the 3C model, as it provides insight into what products or services will be most attractive to them. Companies need to gather data and analyze their customers’ behavior, preferences, and demographics to develop effective marketing strategies.

One of the main benefits of the 3C model’s customer focus is the ability to create customer value. By understanding what customers want and need, companies can tailor their products and services to meet those needs, thus providing value to the customer.

Additionally, by focusing on the customer, companies can differentiate themselves from competitors by providing unique offerings that meet the needs of their target market. This differentiation can lead to increased customer loyalty and brand equity.

However, there are also challenges associated with the customer component of the 3C model. One such challenge is that customers’ preferences and needs are constantly changing, and companies must adapt their strategies accordingly. This requires ongoing research and data analysis to stay ahead of the curve.

Another challenge is that the customer component of the 3C model is not the only factor that influences purchasing decisions. Other factors, such as price, competition, and technological advancements, must also be taken into account.

Despite these challenges, the customer component of the 3C model remains an essential aspect of successful marketing strategies. Companies that prioritize understanding and meeting the needs of their customers are more likely to build long-term relationships and achieve sustainable growth.

Competition

In the 3C model, competition refers to the external factors that can impact a company’s success. Understanding the competition is critical to a company’s success, as it can help identify potential threats and opportunities.

To analyze competition, companies must first identify who their direct competitors are. This involves looking at other companies that offer similar products or services to the same target market. Once the competitors are identified, the company can analyze their strengths and weaknesses.

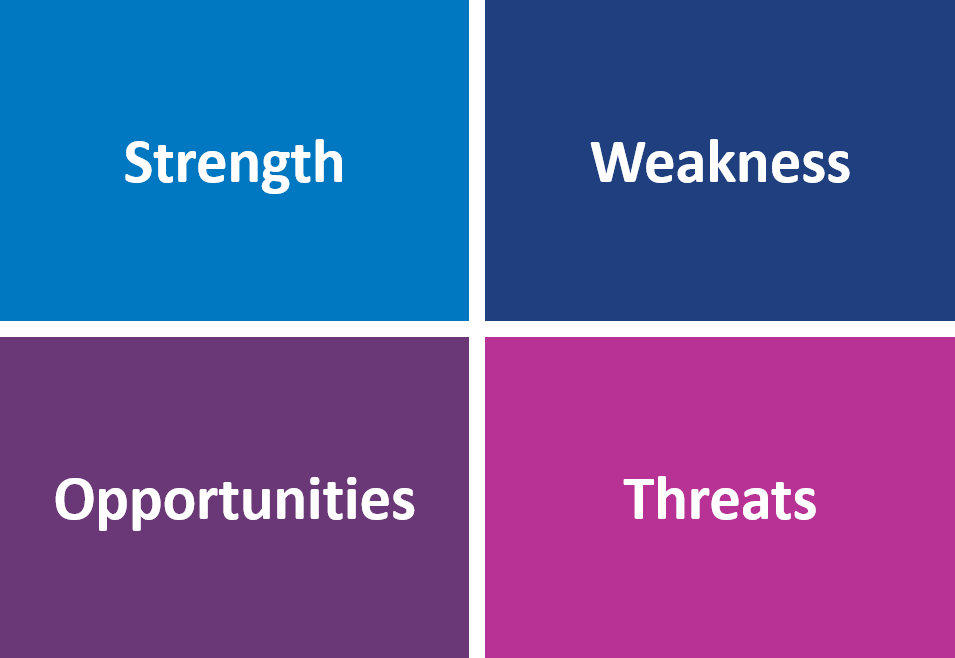
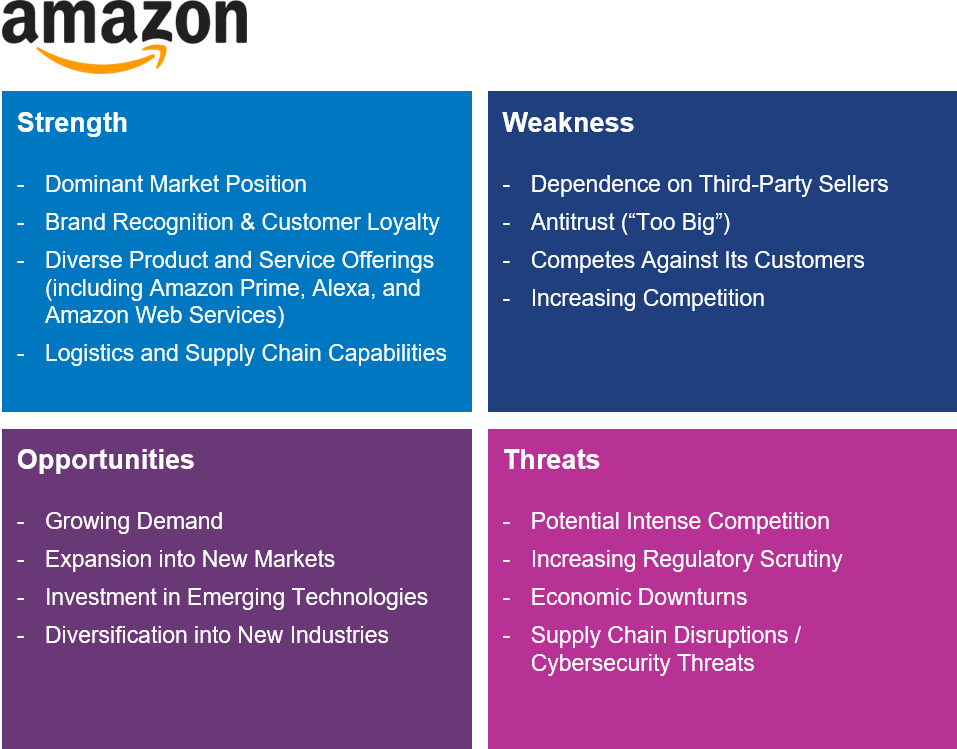
One way to analyze competition is through a SWOT analysis. This can help identify the strengths and weaknesses of the competitors, as well as the opportunities and threats that they present.

Another way to analyze competition is by looking at the market share of each competitor. This can help identify which competitors are dominant in the market and which are struggling.

Companies can also analyze the pricing strategies of their competitors. This can help identify potential pricing advantages and disadvantages.

Additionally, companies can analyze the marketing and advertising strategies of their competitors. This can help identify potential opportunities and threats in terms of reaching the target market.

3C Marketing Model Example

Nike is a global company that designs, develops, and sells athletic footwear, apparel, and accessories. The company operates in more than 190 countries and employs over 75,000 people worldwide. Let’s take a closer look at the company aspect of 3C analysis for Nike.

Nike 3C – Company

One of Nike’s strengths is its strong brand image and reputation. Nike has a well-established brand identity that is recognized globally. Its “swoosh” logo is one of the most recognizable logos in the world, and the company’s tagline, “Just Do It,” is widely recognized and associated with the brand.

Another strength is Nike’s ability to innovate and produce high-quality products. The company invests heavily in research and development to create new and improved products, such as Nike Flyknit and Nike Air. This has helped the company maintain a competitive edge and remain a leader in the athletic apparel and footwear industry.

However, Nike faces some weaknesses in terms of its supply chain management. The company has faced criticism for its labor practices in its overseas factories, including accusations of poor working conditions and low wages. Nike has taken steps to address these issues, but they remain a concern for the company.

Nike also faces challenges in terms of sustainability. As a company that relies heavily on the use of natural resources, such as water and cotton, Nike has a responsibility to reduce its environmental impact. While Nike has made progress in this area, there is still room for improvement.

Overall, Nike has a strong brand identity and innovative product line, but needs to address issues in its supply chain management and sustainability practices to maintain its competitive edge and meet the demands of consumers who are increasingly conscious of ethical and environmental concerns.

Nike 3C – Customer

Nike has a large and diverse customer base, ranging from athletes to fashion-conscious consumers. Their focus on creating high-performance products for athletes has allowed them to establish a strong brand identity and reputation for quality. This has led to a loyal customer base that values the Nike brand and the products they produce.

Nike uses a range of marketing techniques to appeal to their customers, such as advertising campaigns that showcase their products in action and collaborations with high-profile athletes and celebrities. They also invest heavily in research and development to create innovative products that meet the evolving needs and preferences of their customers.

However, Nike also faces challenges in the customer element of the 3C model. The company has been criticized for their labor practices in the past, which can negatively impact their reputation and relationships with customers who value ethical production. Additionally, the company faces increasing competition from both established brands and new entrants in the athletic and athleisure market.

To address these challenges, Nike has taken steps to improve their labor practices and communicate their commitment to ethical production to customers. They have also focused on expanding their product offerings beyond traditional athletic wear to appeal to a wider range of consumers. This includes collaborations with fashion designers and expanding their lifestyle product lines.

Overall, Nike’s focus on creating high-quality, innovative products and their strong brand identity have allowed them to establish a loyal customer base. However, the company must also address challenges such as ethical production and increasing competition to maintain their customer relationships and continue to grow in the market.

Nike 3C – Competition

Nike operates in a highly competitive market. The athletic apparel and footwear industry is dominated by major brands.

Nike faces strong competition from major brands such as Adidas, Under Armour, Puma, and Reebok. Adidas has emerged as a major competitor in recent years, with its focus on retro-style products and collaborations with celebrities and influencers. Under Armour, on the other hand, has positioned itself as a brand that caters to athletes and fitness enthusiasts, while Puma has targeted the lifestyle market. Reebok has focused on sustainability and social responsibility to differentiate itself from its competitors.

Nike has strategically collaborated with other companies in the industry, such as Apple and Amazon, to expand its reach and stay ahead of the competition. For example, Nike’s collaboration with Apple has led to the development of the Nike+ running app, which allows users to track their runs and compete with other runners. Similarly, Nike’s partnership with Amazon has helped the company reach a wider customer base through the online retailer’s vast distribution network.

Nike’s strength lies in its ability to innovate and create products that are technologically advanced and stylish. The company invests heavily in research and development to create new products and improve existing ones, which gives it an edge over its competitors. Nike has also successfully leveraged its brand image and marketing campaigns to create a strong emotional connection with consumers, which has helped it maintain its position as a leading brand in the industry.

Overall, Nike faces intense competition in the athletic apparel and footwear industry, but its strong brand image, innovative products, and strategic partnerships have helped it stay ahead of the curve. The company continues to invest in research and development to stay ahead of its competitors and maintain its position as a leader in the industry.

Learn More

At Lumovest, we’re building the place where anyone can learn finance and investing in an affordable and easy-to-understand manner. Trust us, our courses are far more intuitive, visualized, logical and colloquial than your college professor-taught courses. Our courses are taught by Goldman Sachs investment banker who has worked on transactions worth over $50 billion. We designed our courses to prepare you to succeed in the world of high finance. You’ll learn how to conduct financial analysis exactly like how it’s done on Wall Street’s top firms. Upon completion of the courses, you will receive our Global Financial & Investment Analyst (GFIA) certification. You can sign up here.


4P in Marketing

By Management & Strategy No Comments

What are the 4P in marketing?

The 4Ps of marketing, also known as the marketing mix, are the four key elements of a marketing strategy. These four key elements in 4P are Product, Price, Place, and Promotion. 4P is a very powerful marketing framework, along with the 3C in marketing.

The concept of marketing mix originated in the 1940s and 1950s with marketing theorist Neil Borden. It was popularized by marketer E. Jerome McCarthy in his 1960 book “Basic Marketing: A Managerial Approach.

The Product element refers to the physical or intangible item being sold, including its features, design, quality, packaging, and branding.

The Price element refers to the amount customers pay for the product or service, which is determined by factors such as production costs, competition, and consumer demand.

The Place element refers to the distribution channels used to make the product or service available to customers, including physical locations, online platforms, and third-party retailers.

The Promotion element refers to the various marketing tactics used to promote the product or service, including advertising, public relations, personal selling, and sales promotions.

The 4Ps framework is useful for businesses to create and execute a comprehensive marketing strategy. By using the 4Ps, businesses can ensure they are targeting the right audience, delivering a product or service that meets customer needs, and creating a strong brand identity that resonates with customers. However, some marketers argue that the 4Ps framework is outdated and insufficient in today’s rapidly evolving digital landscape. They suggest adding additional Ps such as People, Process, and Physical evidence to better address the needs of modern businesses.

In this article, we’ll learn in detail each of the elements of 4P and go over real company examples.

4P of Marketing

Product

In the 4P marketing mix, “Product” refers to what a company offers to customers. It encompasses the design, features, packaging, quality, and branding of the goods or services that a company provides.

A key aspect of developing a product is identifying the needs and wants of the target market. Companies must conduct market research to understand what customers are looking for, and then use that information to create products that will satisfy those needs.

Once a product is developed, companies must focus on branding and packaging to create a strong identity and appeal to their target audience. Branding helps differentiate a product from competitors and creates customer loyalty. Packaging, on the other hand, can affect the perception of the product’s quality and its appeal.

Companies also need to consider the product lifecycle, which includes introduction, growth, maturity, and decline. This helps businesses determine when to launch new products, when to discontinue old ones, and how to modify existing products to stay competitive in the market.

Price

Price is one of the most important components of the 4P marketing mix. Setting the right price for a product or service can greatly impact its success. There are several key factors to consider when determining price.

  1. Cost of production: The cost of producing the product or service is a crucial factor to consider when setting the price. Companies must ensure that the price covers the cost of production while still generating a profit.
  2. Competitors’ prices: It is important to analyze competitors’ prices to determine a competitive price point. Companies can choose to price their products higher or lower than competitors, depending on factors like brand image and product differentiation.
  3. Customer value: The value that customers place on a product or service can impact its price. Companies must understand their target market and determine the maximum price that customers are willing to pay.
  4. Marketing strategy: The pricing strategy should align with the overall marketing strategy. For example, a company that focuses on a high-end, luxury image will likely set higher prices for its products.
  5. Discounts and promotions: Discounts and promotions can be used to attract customers and boost sales. Companies must carefully consider the impact of discounts and promotions on profit margins and overall revenue.
  6. Seasonal factors: Seasonal factors can impact pricing, with demand often fluctuating throughout the year. For example, prices for holiday products may be higher during the holiday season.

By taking these factors into account, companies can set a price that reflects the value of their product or service, while also remaining competitive in the market.

Place

The “Place” element of the 4P marketing mix refers to how a company distributes its products to customers. This includes the physical locations where the products are sold, the channels used to reach customers, and the logistics involved in getting products to customers.

One important factor to consider when determining the “Place” element is the target market. For example, a company selling luxury products may choose to sell its products in high-end boutiques, while a company selling everyday products may choose to sell its products in grocery stores or convenience stores.

Another important factor is the distribution channels used to reach customers. Companies can choose to distribute their products through wholesalers, retailers, or even directly to customers through e-commerce. The chosen distribution channel can have a significant impact on the availability and accessibility of the product to customers.

Logistics is another important aspect of the “Place” element. Companies need to ensure that their products are delivered to customers in a timely and efficient manner. This involves managing inventory levels, transportation, and warehousing.

The rise of e-commerce has significantly impacted the “Place” element of the marketing mix. Companies can now sell their products directly to customers through online platforms, which has created new opportunities for reaching customers and expanding into new markets.

When considering the “Place” element, companies also need to take into account any legal or regulatory requirements related to distribution and sales of their products. For example, certain products may require special licenses or permits to sell in certain locations.

Promotion

Promotion is the fourth and final element of the 4P marketing mix. It includes all the methods used to communicate and promote a product or service to potential customers.

Promotion involves various strategies such as advertising, sales promotion, public relations, personal selling, and direct marketing.

Advertising is a paid form of promotion that can include print ads, online ads, radio and television commercials, billboards, and more. Sales promotion includes short-term incentives to boost sales, such as discounts, coupons, contests, and giveaways.

Public relations involves managing the company’s image and reputation through various means, such as press releases, sponsorships, and events. Personal selling involves a direct, one-on-one interaction between a salesperson and a potential customer, and is often used for high-value or complex products.

Direct marketing involves reaching out to potential customers directly through email, mail, or other channels. It can be highly targeted and personalized, making it an effective way to reach specific segments of the market.

The ultimate goal of promotion is to create awareness, generate interest, and motivate potential customers to take action, such as making a purchase or requesting more information.

A well-designed promotion strategy can help a company differentiate its products or services from the competition, build brand awareness and loyalty, and ultimately drive sales and revenue. However, if not executed properly, it can also be a waste of time and resources.

4P vs. 7P Marketing Mix

The 4P’s of marketing, as previously mentioned, are Product, Price, Place, and Promotion.

However, in recent years, three more elements have been added to the marketing mix, namely People, Process, and Physical Evidence. These additional three elements, together with 4P’s, are referred to as the 7P’s of marketing, and they help businesses to consider the overall customer experience. While the original 4P’s focus on creating the right product, at the right price, in the right place, and with the right promotional activities, the additional 3P’s allow for a more comprehensive approach to marketing.

The People element refers to the staff and employees who interact with customers and help to deliver the product or service.

The Process element focuses on the way in which the product or service is delivered to the customer and the steps involved in the overall experience.

Finally, Physical Evidence includes all of the tangible elements that customers experience when interacting with the product or service, such as atmosphere, store layout, and website design.

The 7P’s of marketing provide a more complete approach to marketing, by considering not just the product itself, but also the people involved, the process of delivery, and the overall customer experience.

4P Marketing Mix Example: Coca Cola

Coca Cola is a global beverage company with a diverse portfolio of products. Let’s take a closer look at its marketing mix.

Coca Cola 4P Example: Product

Coca-Cola is a carbonated soft drink that has been a household name for over a century. It is a classic product that has stood the test of time and remained relevant for generations. Coca-Cola has a wide variety of products, including Diet Coke, Coca-Cola Zero, Sprite, Fanta, and more. They are available in a variety of sizes, including cans, bottles, and even fountain drinks.

Coca-Cola invests heavily in product development to keep up with changing consumer preferences. In recent years, they have introduced new flavors, such as Cherry Coke, Vanilla Coke, and Orange Vanilla Coke, to cater to the evolving tastes of their customers. They also offer seasonal flavors, such as Coca-Cola Cinnamon during the holidays.

Coca-Cola’s branding is a key aspect of its product. The company’s iconic red and white logo is recognized around the world. The brand is associated with happiness, joy, and refreshment. Coca-Cola’s marketing campaigns are centered around the idea of sharing and bringing people together.

In terms of packaging, Coca-Cola offers a variety of options, including plastic bottles, aluminum cans, glass bottles, and more. They have also recently introduced a sleek, modern design for their aluminum cans, which has been well-received by consumers.

Here are our key takeaways. First, Coca Cola has a strong brand identity that is recognized globally. Marketers should focus on maintaining this recognition and using it to their advantage. Second, with increasing concerns about health and wellness, marketers should consider the impact of health and wellness trends on consumer behavior and tailor their product offerings accordingly. And lastly, Coca Cola has a long history and has successfully tapped into consumers’ nostalgia through marketing campaigns. Marketers should consider the value of nostalgia in building emotional connections with consumers.

Coca Cola 4P Example: Price

Price is a critical element of Coca Cola’s marketing mix strategy. The company offers its products at different price points to cater to different market segments. Coca Cola uses a value-based pricing strategy, which means that it prices its products based on the perceived value to the customer.

For example, in the United States, a 20-ounce bottle of Coca Cola costs about $1.79, while a 2-liter bottle costs around $1.99. The company also offers discounts on its products, such as buy-one-get-one-free offers, to increase sales and attract price-sensitive customers.

Coca Cola also uses skimming pricing strategy for its premium products such as Coca Cola Life and Coca Cola Zero Sugar. For instance, Coca Cola Life is priced higher than regular Coca Cola because it is positioned as a healthier alternative.

Moreover, Coca Cola employs geographic pricing strategy. The price of Coca Cola products varies across different regions based on factors such as competition, demand, and local economic conditions. In developing countries, Coca Cola products are often priced lower to appeal to price-sensitive consumers.

In addition to the above pricing strategies, Coca Cola also engages in dynamic pricing. For example, during the holiday season, the company may increase the price of its products due to higher demand. Alternatively, during off-peak periods, Coca Cola may lower its prices to stimulate sales.

Here are some key takeaways. First, understand the perceived value of the product to the target market and use it to set the price. Second, offer products at different price points to cater to different segments of the market. Third, consider the competitive landscape and local economic conditions when setting prices in different regions.

By applying these key takeaways, Coca Cola can continue to implement effective pricing strategies that attract and retain customers while achieving business objectives.

Coca Cola 4P Example: Place

Place is all about getting the right product to the right place at the right time. Coca Cola has an incredibly broad distribution network, and its products are available in nearly every corner of the globe. The company has more than 700,000 distribution points worldwide, including both large and small retailers, vending machines, restaurants, and more.

Coca Cola uses several strategies to ensure that its products are widely available. The company partners with local bottlers and distributors to ensure that its products are available in remote locations. It also has a strong relationship with major retailers, such as Walmart and Costco, to ensure that its products are prominently displayed and readily available in high-traffic areas.

Coca Cola has also invested heavily in technology to ensure that its products are always in stock. The company uses data analytics and machine learning algorithms to predict demand and optimize its supply chain. This helps the company to reduce waste and ensure that its products are always in stock, even during times of high demand.

One of Coca Cola’s key marketing strategies is to make its products available in as many places as possible. The company wants its products to be readily available, so that customers can purchase them whenever and wherever they want. By making its products widely available, Coca Cola can ensure that its products are top-of-mind for consumers, which can help to drive sales.

Overall, Coca Cola’s place strategy is focused on making its products as widely available as possible. By partnering with local distributors, investing in technology, and using a variety of promotional strategies, Coca Cola can ensure that its products are always in stock and top-of-mind for consumers.

Coca Cola 4P Example: Promotion

Promotion is a critical element of Coca Cola’s marketing mix, and the company leverages various strategies to create brand awareness, build customer loyalty, and foster an emotional connection with consumers.

To increase brand awareness, Coca Cola invests in advertising campaigns, using various channels such as television, billboards, and print media. For instance, the company’s “Taste the Feeling” campaign focused on creating a strong emotional appeal by connecting consumers’ experiences with the brand. In addition, Coca Cola partners with popular events and organizations, such as the Olympics and FIFA, to increase its reach and brand exposure.

To build customer loyalty, Coca Cola employs various tactics, such as personalized marketing, rewards programs, and sponsorships. The company’s personalized marketing efforts include customized packaging and unique promotional campaigns that engage consumers and create a sense of exclusivity. Coca Cola also runs rewards programs such as “Coca Cola Rewards” that incentivize customers to purchase more products and earn exclusive rewards.

Finally, Coca Cola aims to foster an emotional connection with consumers by creating memorable experiences that resonate with their emotions. For instance, the company’s “Share a Coke” campaign encouraged consumers to find and share bottles with their names on them, creating a personal and emotional connection with the brand. Coca Cola also leverages social media to connect with its audience and create a sense of community around its products.

Learn More

At Lumovest, we’re building the place where anyone can learn finance and investing in an affordable and easy-to-understand manner. Trust us, our courses are far more intuitive, visualized, logical and colloquial than your college professor-taught courses. Our courses are taught by Goldman Sachs investment banker who has worked on transactions worth over $50 billion. We designed our courses to prepare you to succeed in the world of high finance. You’ll learn how to conduct financial analysis exactly like how it’s done on Wall Street’s top firms. Upon completion of the courses, you will receive our Global Financial & Investment Analyst (GFIA) certification. You can sign up here.

Accounting Equation

By Accounting No Comments

What is the Accounting Equation?

The Accounting Equation states that the total value of a company’s Assets must equal the total value of its Liabilities and Equity.

It’s called the Accounting Equation because it sets the foundation of the double-entry accounting system. The double-entry accounting system is a method of accounting where every change to the Assets section must have either (1) an offsetting change in Assets section or (2) a matching change to Liabilities and Equity. The system is the go-to accounting method of the modern day. And Accounting Equation is the premise on which the double-entry accounting system is built. Hence, it’s called the Accounting Equation.

This is also a cornerstone concept that underpins the Balance Sheet. The Balance Sheet shows the value of what the company owns (Assets), owes (Liabilities) and value left to owners (Equity). The Accounting Equation captures the relationship between Assets, Liabilities and Equity through a simple formula. It states that the Assets section must equal the sum of the Liabilities and Equity sections. The value of what a company owns must equal the value of what it owes and value left to owners. For this reason, the Accounting Equation is also known as the Balance Sheet Equation.

Accounting Equation Formula

[Formula Picture]

This is the standard formula. Assets = Liabilities + Equity. When this formula is true, we say that the Balance Sheet “balances”. Based on this formula, we can rearrange the variables to derive its variations:

[Formula Picture]

Assets: Asset is anything that the company controls that has value, anything that benefits the company. Common items in the Assets section include: Cash & Cash Equivalents, Accounts Receivables, Prepaid Expenses, and PP&E.

Liabilities: Liability is anything that has value that the company owes to other parties. Common items under the Liabilities section include: Current Portion of Long-Term Debt, Accounts Payables, Accrued Expenses, Deferred Revenue, Long-Term Debt, and Capital Leases.

Equity: Equity on the Balance Sheet shows the value entitled to the company owners. It’s the value of Assets leftover to the shareholders after covering all Liabilities. Common Equity items include: Common Stock Par Value, Additional Paid-In Capital, Retained Earnings, and Shareholder’s Equity.

Accounting Equation Example

Here’s a real Balance Sheet from Netflix (NASDAQ: NFLX). You can find the company’s Balance Sheet on PDF page 46 of the company’s annual report.

[Picture]

On Netflix’s Balance Sheet, we highlighted total Assets in red and total Liabilities & Equity in green. These two lines must always equal. We can see that the company had $25,974,400,000 in total Assets and $25,974,400,000 in total Liabilities & Equity. The Balance Sheet balances.

How to Use the Accounting Equation

People generally use the Accounting Equation for three purposes. First, we use it as a guide in journal entry. Second, we use it to check that the Balance Sheet balances. And third, we use it to solve missing variables.

Guide in Journal Entry:

Accountants use the Accounting Equation as a guide in their journal entries. It helps them frame how they determine accounts to debit & credit. Every transaction alters the company’s Assets, Liabilities and Equity. It’s the accountants’ responsibilities to keep an accurate journal of these transactions. Every transaction’s impact to Assets must have either offsetting impact to Assets or matching impact to Liabilities and Equity.

For example, a $100 increase in an item under Assets must be met with either a $100 decrease in another Asset item or a $100 increase in Liabilities and Equity. If the accountants keeps accurate records, the Accounting Equation will always “balance”. It should always balance because every business transaction affects at least two of a company’s accounts.

[Picture]

Suppose a company spends $100 to purchase a chair with cash. The company’s PP&E value increases by $100 because it now owns an extra chair worth $100. But its Cash & Cash Equivalents value decreases by $100 because it used $100 to buy the chair. The $100 increase in PP&E is offset by the $100 decrease in Cash & Cash Equivalents. So the total value of Assets is left unchanged. The Accounting Equation balances.

[Picture]

Alternatively, suppose the company decided to borrow $100 to buy the chair as opposed to using its own cash. Then the PP&E will go up by $100, so Assets increase by $100. But Debt will also go up by $100 because the company had borrowed the money. This matching impact increases Liabilities & Equity by $100. The Accounting Equation balances.

Check Balance Sheet:

Remember, the total value of Assets must always equal the total value of Liabilities and Equity. We use the Accounting Equation to check Balance Sheets. Any Balance Sheet whose total Assets value does not equal the sum of its Liabilities and Equity values is wrong.

Step 1: Find the company’s “Total Assets” line on the Balance Sheet.

Step 2: Find the company’s “Total Liabilities & Equity” line on the Balance Sheet. If the company does not have “Total Liabilities & Equity”, add together “Total Liabilities” and “Total Equity”.

Step 3: Compare the values from Step 1 and Step 2 to make sure they are equal. If they are not, the Balance Sheet is wrong.

Total Assets must equal total Liabilities plus total Equity. There are no exceptions. It’s always the case. So simply checking whether the Balance Sheet balance can tell you whether the statement is wrong.

Solve Missing Variables:

Recall that the Accounting Equation is Assets = Liabilities + Equity. Anytime we have two of the three components, we can solve for the third missing variable. For example, if we know a company’s total Asset is $700 and Liabilities is $300, then Equity must equal $400.

Why Assets Must Equal Liabilities Plus Equity

It’s a rule that Assets must always equal Liabilities plus Equity. But why? Why must Assets always equal the sum of Liabilities plus Equity? To answer this question, we need to rearrange the Accounting Equation to as follows:

[Equity = Assets – Liabilities]

This formula is a lot easier to understand. If you take the total value of Assets and subtract the total value of Liabilities, then the remainder is value for Equity holders. Said differently, whatever value of the company’s Assets remains after covering its Liabilities belong to the owners. Whatever value is left after the company pays the money it owes to banks, suppliers, and employees belong to the company owners. This is how things work in this world.

The value of your house after paying down mortgage belongs to you. Likewise, whatever value of your car is left after repaying car loans belong to you. Whatever value of your restaurant is left after paying for all the required expenses belong to you. The money in your bank account after you repay outstanding debt (i.e. student loans, mortgage, credit cards) belongs to you.

Suppose you buy a house for $200,000 with $120,000 in mortgage and $80,000 of your own money. The Asset value of the house is $200,000. That’s the value of the house. But you owe $120,000 to the banks. The value of the house after deducting the liability belongs to you, which is $80,000.

You own something after you buy it. And you have to repay what you owe. As long as this is how things work in life, Assets must always equal Liabilities plus Equity.

Limitations of the Accounting Equation

The main limitation of the Accounting Equation is that it doesn’t tell us anything about the company. The formula is more of a principle than a metric that yields significant insight. It tells us how things should be for all companies. It tells us that Assets must equal Liabilities and Equity. Said differently, it states whatever value of Assets left after covering Liabilities is entitled to Equity holders. It doesn’t tell us anything unique about any specific business. It doesn’t tell us how the business is performing, whether its financial health, or how much the company is worth. Investors and analysts have to analyze the financial statements to derive insights into the business performance.

Another limitation of the Accounting Equation is that it can’t tell you if the company’s records are accurately recorded. It can tell you if the records are wrong. If the transactions don’t balance, they’re wrong. But you can’t tell if they’re accurate. A balanced Accounting Equation by itself is insufficient to certify the accuracy of a company’s records. A company’s accounts and Balance Sheet can balance and still for the entries to be wrong. Instead of recording the purchase of the chair for $100, for example, they could record it at $10. So it can tell you if the records are wrong, but it can’t certify if the records are accurate.

Accounting Principles

By Accounting No Comments

What are Accounting Principles?

Accounting Principles are the set of rules and guidelines that govern how companies record and report financial data. They are extremely important because they standardize the way companies present their financials. They standardize and regulate accounting definitions, assumptions, and methods. For example, these principles lay forth the exact criteria under which a company may record revenue. Any well-trained Analyst will understand what a company’s revenue represents because it’s clearly defined with a standardized set of criteria.

You can think of these principles as the grammar behind a language. Just like grammar governs how we use words, these principles govern how companies record financial data. Without grammar, there wouldn’t be a standardized way of constructing sentences and people’s words wouldn’t make any sense. Likewise, without Accounting Principles, companies wouldn’t have a standardized method of recording financials. Different companies’ financial statements would use different methodologies, which will be extremely confusing for Analysts. Companies would also have wide leeway to manipulate financials. That’s why governments all over the world require companies to follow Accounting Principles. It creates a uniform accounting methodology and reduces room for fraud.

Globally, there are three sets of accounting standards that most established companies follow. American companies and those that trade on the American stock exchanges follow the US GAAP, or Generally Accepted Accounting Principles. Chinese companies follow China GAAP. The rest of the world outside of the US and China follow the International Financial Reporting Standards (IFRS). Here’s a map of the countries that adopt IFRS.

American Accounting Principles

American companies follow the US GAAP (Generally Accepted Accounting Principles) when they record their financials. This helps companies across the country prepare financials using a consistent methodology.

In the US, the Securities and Exchange Commission (SEC) has the legal authority to set accounting standards for public companies. However, the SEC looks to a private non-government organization, Financial Accounting Standards Board (FASB), for their technical expertise. As a result, FASB often takes the leadership role in setting and improving the US GAAP.

While FASB has the power to set accounting rules, it does not have the power to enforce. That’s where the SEC comes in. SEC works closely with FASB on the accounting standards and makes sure all the major companies comply.

Small businesses don’t necessarily have to follow this set of rigorous accounting standards. They have leeway because they are usually privately-owned within families. However, large businesses with many investors, especially public companies, usually have to comply with US GAAP.

China Accounting Principles

The Chinese Accounting Standards (CAS), or “China GAAP”, govern accounting and bookkeeping practices in China. All Chinese public companies must follow China GAAP when preparing their financial statements.

Chinese accounting standards and presentation formats were historically very different from that of the western world. However, in April 2010, the Chinese Ministry of Finance issued “Roadmap for Continuing Convergence of Chinese Accounting Standards for Business Enterprises with International Financial Reporting Standards”. It indicated that it will revise and improve China GAAP to converge closer to IFRS that the rest of the world follow. Today, China GAAP is very similar to that of IFRS.

Rest of World Accounting Principles

Outside of the United States and China, most countries follow the IFRS (International Financial Reporting Standards). The IFRS is a set of rules governed by the IFRS Foundation and the International Accounting Standards Board (IASB).

Globally, over 150 countries follow IFRS as their accounting standard. These countries require domestic public companies to follow the IFRS when recording their financials. IFRS is widely popular is because it makes financial statements understandable and comparable across international boundaries. European investors can easily understand African companies and Latin American analysts can easily evaluate Middle Eastern companies. There is a global trend of growing international shareholding and trade. IFRS is progressively replacing many countries’ own national accounting standards to develop a uniform global set of accounting standards.

10 Important Accounting Principles

Across the world, there are a number of key accounting principles. They form the foundation upon which US GAAP, China GAAP and IFRS build their set of rules and guidelines. We lay out the 10 most important ones below.

  1. Separate Entity Assumption

    This principle states that accountants should record business transactions separately for each entity. First, this principle requires separation of business transactions and personal transactions. This prevents business owners’ personal transactions from mixing up measurements of business performance. Consequently, the financial statements will reflect purely the business results. Second, this principle requires accountants to avoid intermingling business transactions among different entities. Each business entity should have its own set of transactions.

  2. Monetary Unit Principle

    The Monetary Unit Principle states that only accounts measurable with monetary units can be recorded in the company’s financial statements. If a transaction is quantifiable with money, the accountant should record it. If a transaction is not quantifiable with money, then the accountant should not record it. This principle prevents accountants and management teams from recording transactions based on subjective opinions.

  3. Time Period Principle

    This principle says that businesses should report their performance for a specific time period. All financial statements must indicate the time period they are for in order to be meaningful. Without specifying time period or consistency, the numbers would be meaningless. Whereas the Income Statement and the Cash Flow Statement report financials over a period of time, the Balance Sheet report financials as of a specific point in time.

  4. Materiality Principle

    The Materiality Principle requires accountants to record information that are “material” (significant) when preparing financial statements. Most businesses have sophisticated control systems that record all their transactions. Therefore, the major implication of this principle isn’t about material transactions, but about immaterial (insignificant) transactions.

    This principle allows accountants some liberty in how they treat immaterial transactions. A common usage of this principle is to expense immaterial costs rather than to capitalize them. For example, suppose a company purchased $100 of office supplies. If the $100 is immaterial, the accountant can record the $100 as part of the year’s SG&A expense. However, if the $100 is material, then the accountant will have to follow the standard procedure. They may have to capitalize the office supplies where the $100 adds to PP&E and depreciate over the supplies’ remaining lifespan.

    Materiality is a vague concept without an exact definition. Hence, we often have to rely on accountants’ professional opinion. What is material to one business might be immaterial to another. For example, spending $100 buying office supplies might be material to a local store, but will be immaterial to Amazon.

  5. Accrual Principle

    Under the Accrual Principle, companies recognize revenue when they deliver the products and when the collection of payment is reasonably certain. Notice that revenue is not recognized based on when the company receives the cash payments from the sale. In other words, revenue is a measure of the value of products sold as opposed to cash received.

  6. Matching Principle

    The Matching Principle requires companies to recognize expenses in the same period as the corresponding Revenue. Companies “match” revenue and related expenses together and record them in the same period. If an expense is directly attributed to revenue (i.e. cause and effect relationship), the company should record it in the same period as the corresponding Revenue. If an expense isn’t directly attributable to Revenue, the company should record the expense in the period that it was used.

  7. Cost Principle

    The Cost Principle requires companies to record their Assets, Liabilities and Equity items on the Balance Sheet at their historical cost. The definition of historical cost is the value of money it pays or receives at the time of transaction (“cost basis”). This is an aspect of conservatism within financial accounting. For example, companies often sell their products at a higher price than their cost. However, accountants have to base product values on historical cost rather than what they can sell for. In other words, the value of inventory on the Balance Sheet is based on how much it cost the company to produce these inventory. It’s not based on the value these inventory can sell for.

    Another example is real estate. Suppose a company purchased a building 30 years ago that’s worth 100 times as much today. However, despite the higher valuation, the company must record the value of the building at its historical cost. It has to record the value of the building according to how much it originally cost to acquire the building. Cost Principle injects an aspect of conservatism into financial statements.

  8. Continuity Principle (aka “Going Concern Principle”)

    The Continuity Principle allows accountants to assume that a company will continue to exist in the foreseeable future. This transaction underpins various line items on the financial statements, such as D&A, Prepaid Expenses, Deferred Expenses, etc. Without this assumption, companies have to record these expenses right away because the company will cease to exist.

  9. Conservatism Principle

    The leading accounting standards generally require accountants to be conservative when preparing financial statements. This principle has two main implications.

    First, it requires accountants to choose the more conservative methodology in situations where there are more than one acceptable methodologies. If there’s an accounting method that yields lower Diluted EPS, then accountants should opt for that method instead.

    Second, it impacts various accounting rules on how companies record income vs. expenses, and assets vs. liabilities. For example, companies must record impairment expense when the fair market value is below the carrying value. However, the opposite is not true. They may not record gains when the fair market value is above the carrying value. Similarly, companies must disclose potential liabilities under Commitments & Contingencies. But the same rules don’t require them to disclose potential income streams.

  10. Consistency Principle

    The Consistency Principle requires companies to maintain the same accounting methodology from one period to the next. Companies may not fluctuate between altering methodologies from period to period whenever it suits them. They must stay consistent with their chosen methodology. Those who do change their methodology must fully disclose the change and its implications. The analyst community usually heavily scrutinize changes in methodologies.

These are the 10 main accounting principles. There are many other accounting principles, but the ones above are the most important. They form the foundation of the leading sets of accounting rules and guidelines.

How to Use These Accounting Principles

These accounting principles form the basis on which companies prepare their financial statements. Accountants use these rules as a guide when recording journal entries and preparing statements. Analysts need to keep these rules in mind when they analyze financial statements to understand the context behind the numbers.

In our Lumovest courses, we’ll build upon these principles and walk you through how to analyze financial statements step-by-step. You can watch how it’s done through lesson videos and then practice the analysis through our worksheets. Sign up today for just $30.

Accounts Payable

By Accounting No Comments

What is Accounts Payable?

Accounts Payable is the value of money the company owes to other businesses for goods and services it received. The company has already obtained what it purchased, but it hasn’t paid yet.

When companies order and receive products before paying for them with cash, they are purchasing on account. The companies haven’t paid for these accounts yet, but they’ll eventually pay for them. Hence, these accounts are payable. This is why money owed to suppliers and vendors is known as Accounts Payable.

Accounts Payable arise because large companies, especially those in the B2B space, don’t pay at the time of purchase. There’s often days to weeks of gap in between when they receive the order and when they pay. Whereas regular consumers would pay at the point of purchase, large companies would pay 30-90 days later.

Accounts Payable appears on a company’s Balance Sheet under the Liabilities section. It’s a liability because it represents the money a company owes to suppliers. Companies usually have to settle the payment within a year. Meaning, companies usually have to pay suppliers what they owe within a year. Therefore, Accounts Payable is often considered a Current Liability.

Accounts Receivable

By Accounting No Comments

What is Accounts Receivable?

Accounts Receivable is the value of money customers owe the company for goods and services they purchased. Customers had already ordered and received what they purchased, but haven’t paid for them yet. Said differently, it’s the money the company can collect from customers in the future for products it has already provided. If a company has $400 million of Accounts Receivable, it means the company has yet to collect $450 million from customers for products it has already provided.

Accounts Receivable arise because large companies, especially those in the B2B space, don’t pay at the time of purchase. There’s often days to weeks of gap in between when customers receive the order and when they pay for them. Whereas consumers would pay at the point of purchase, large companies would pay 30-90 days later. Some might even extend into the 180 day timeframe. This time lag creates Accounts Receivable.

When customers buy things without paying for them, we say that they’re buying on account. The company hasn’t received cash for these accounts but it’ll eventually receive the cash payments. Hence, the accounts are receivable. Therefore, we call it “Accounts Receivable”.

Accounts Receivable is a Current Asset on the Balance Sheet. It’s an Asset because it represents money the company can collect in the future. Remember, it’s the money customers owe the company. Not the other way around. The customers are the ones who will pay money to the company. Therefore, it’s an Asset to the company. Specifically, it’s a Current Asset because customers usually pay within 30-90 days. Since the company can collect cash payments within a year, it’s a Current Asset.

Accrued Expenses

By Accounting One Comment

What are Accrued Expenses?

Accrued Expenses is the value of money the company owes that have accrued over time. It represents the amount of expenses the company has incurred but not yet paid. The word accrued just means accumulated. Naturally, you can think of it as expenses the company accumulated over time but not yet paid.

This is a common line item on the Balance Sheet, under the Liability section. It’s considered a Current Liability because the liability is usually settled with cash payments within one year.

Accrued Expenses vs. Accounts Payable

Accrued Expenses is very similar to Accounts Payable. Both represents money not yet paid for expenses the company has already incurred. However, there’s a subtle difference.

Accounts Payable refers to money owed for expenses that are incurred at a specific point in time. For example, let’s assume a company ordered and received $500 of office supplies but hasn’t paid yet. That $500 is Accounts Payable.

By contrast, Accrued Expenses refers to money owed for expenses that accumulate over time. Common examples are wages, rent and utilities. Take wages for example. The company accrues wage expense everyday but they don’t pay wages until every 2 weeks or every month. The wages that accrue over time but not yet paid is included in this line item. Similar concept goes for rent and utilities expense. Companies use electricity every day. The electricity expense accumulate over time and is only paid at the end of the month. Hence, the money owed for the expense is captured as part of Accrued Expenses as opposed to Accounts Payable.

For many companies, Accounts Payable mostly relate to expenses with suppliers and vendors. It’s money owed to other businesses that sell products to the company. On the other hand, Accrued Expenses primarily consist of employee salary and wages, rent, utilities and interest. There are other expenses that accrue over time, but these are the most common items. Companies that have significant accumulated expenses might break it out by category: Accrued Wages, Accrued Rent, and Accrued Interest.

Accumulated Other Comprehensive Income

By Accounting No Comments

What is “Accumulated Other Comprehensive Income”?

Accumulated Other Comprehensive Income (AOCI) represents the cumulative total of gains and losses not yet recognized on the Income Statement. We go over this topic in greater detail in our finance curriculum: Course 10 – Lesson 27.

Why can’t companies recognize some gains and losses on the Income Statement? Because in order for companies to record gains and losses on the Income Statement, they must realize them. If they realize the gains and losses, they may record them on the Income Statement. If the gains and losses are unrealized, companies may not record them on the Income Statement.

In other words, AOCI represents the cumulative unrealized gains or losses from transactions or events not included in Net Income. On the financial statements, AOCI appears as its own line item under the Shareholder’s Equity section.

Examples of items that can impact AOCI include foreign currency translation gains and losses, changes in the fair value of certain financial instruments, and adjustments for certain post-employment benefits.

AOCI is important because it can have a significant impact on a company’s financial statements and overall financial position. For example, if a company has significant unrealized gains in its investments, companies would reflect these gains in AOCI. Over time, these gains would eventually flow into Net Income. This can make the company appear less profitable today than it actually is.

AOCI can also impact a company’s financial ratios and metrics, such as Return on Equity (ROE). This is because Shareholder’s Equity (denominator in EPS) includes AOCI.

Overall, AOCI is an important concept to understand for investors and analysts. By understanding AOCI, investors can gain a better understanding of the impact unrealized gains & losses may have on the company’s financial statements over time.

Here’s how Accumulated Other Comprehensive Income appears on the Balance Sheet for J.M. Smucker.

Accumulated Other Comprehensive Income Example
Accumulated Other Comprehensive Income Examples

So now we understand what AOCI is. Let’s look at some examples of things that go into Accumulated Other Comprehensive Income.

Foreign Currency Translation Gains and Losses: Let’s say a company has operations in several countries with different currencies. This is very common among big corporations. In this case, it will need to translate the financial statements of those operations into the company’s reporting currency. Companies include the resulting foreign currency gains or losses in AOCI.

Unrealized Gains and Losses on Investments: Let’s say a company has investments in securities such as stocks or bonds. Companies include the unrealized gains or losses on those investments in AOCI until they realize these gains or losses.

Pension Liability Adjustments: Changes in the value of a company’s pension plan assets and liabilities can impact AOCI. For example, let’s say a company’s pension plan assets increase in value. The company may include the resulting gain in AOCI until it realizes the gains in some way.

Derivative Financial Instruments: Changes in the fair value of certain derivative financial instruments can impact AOCI until they are settled. Examples of common derivative financial instruments that public companies have include interest rate swaps or commodity futures contracts.

These are some examples of items that go into AOCI.

Accumulated Other Comprehensive Income Formula

Now let’s look at an AOCI example with some numbers. In general, we can calculate AOCI as the sum of Foreign Currency Translation Losses, Changes in Fair Value of Financial Instruments, and Pension Liability Adjustments.

Accumulated Other Comprehensive Income Formula

Let’s say a company has the following items that impacted AOCI over time:

Foreign Currency Translation Losses: $(5) million

Unrealized Gains on Available-for-Sale Securities: $10 million

Pension Liability Adjustments: $2 million

Applying the above formula, AOCI equals $10 million – $5 million + $2 million, which equals $7 million. Thus, AOCI for this company is $7 million.

Negative AOCI

It’s called “Accumulated Other Comprehensive Income” if the cumulative number is positive, meaning there’s a net gain. However, if the cumulative number is negative, it means there’s a net loss. In that case, it’s called “Accumulated Other Comprehensive Losses”.

To simplify things, companies often call this line item “Accumulated Other Comprehensive Income & Losses”.

AOCI Accounting Rules

There are several accounting rules that apply to Accumulated Other Comprehensive Income (AOCI). Here are a few key points to keep in mind:

  1. AOCI is reported on the Balance sheet, under the Shareholder’s Equity section.
  2. Items included in AOCI are typically unrealized non-operating gains and losses. AOCI includes gains and losses that are not part of a company’s core business operations. These items are things such as foreign currency translation gains and losses or unrealized gains and losses on investments.
  3. AOCI is subject to reclassification. As companies realize the gains and losses in AOCI, they may reclassify the items from AOCI to Net Income. For example, accounting rules require companies to reclassify gains or losses on available-for-sale securities from AOCI to Net Income when they sell the securities.
  4. AOCI is subject to amortization. In some cases, items that companies include in AOCI may be subject to amortization. For example, companies amortize pension liability adjustments over time as they pay off pension obligations.
  5. AOCI is a part of Comprehensive Income. Comprehensive Income is a broader measure of a company’s financial performance that includes gains and losses not in Net Income.

These are some accounting rules that apply to AOCI.

Learn More

At Lumovest, we’re building the place where anyone can learn finance and investing in an affordable and easy-to-understand manner. Our courses are far more intuitive, visualized, logical and colloquial than your college professor-taught courses. Our courses are taught by Goldman Sachs investment banker who has worked on transactions worth over $50 billion. We designed our courses to prepare you to succeed in the world of high finance. You’ll learn how to conduct financial analysis exactly like how it’s done on Wall Street’s top firms. Upon completion of the courses, you will receive our Global Financial & Investment Analyst (GFIA) certification. You can sign up here.

Acquisitions, Net of Cash Acquired

By Accounting No Comments

What is “Acquisitions, Net of Cash Acquired”?

“Acquisitions, Net of Cash Acquired” is a common line on the Cash Flow Statement. It measures the net amount of cash a company spent to acquire other companies. For example, suppose a company’s Cash Flow Statement shows $500 million for “Acquisitions, Net of Cash Acquired”. This means the company used $500 million of cash to buy other companies.

Most for-profit companies want to grow. Growth allows the companies to earn more profits and generate greater return for their shareholders. Companies can grow organically by building their own operations or grow inorganically by acquiring other companies. The latter is known as “Mergers & Acquisitions” or M&A for short. M&A is very popular. Each year, thousands of M&A transactions worth trillions of dollars take place around the world. Many companies purchase other companies to become larger and strengthen their competitive position in the industry. In order to make the transactions happen, the buyers have to pay the sellers. In most instances, buyers pay the sellers with cash. How much cash? That’s what the line “Acquisitions, Net of Cash Acquired” measures.

Why does “Net of Cash Acquired” mean?

The first half (“Acquisitions”) of “Acquisitions, Net of Cash Acquired” is very intuitive. It clearly indicates that the cash is being spent on acquisitions. However, what about the second half (“Net of Cash Acquired”)? Why does the name include it and what does that even mean?

Companies have their own business bank accounts. Nike has its bank accounts and Netflix has its own bank accounts. Just like regular people, companies keep their cash in these bank accounts. When Company A acquires Company B, Company A becomes the owner of Company B. Therefore, Company A owns all of Company B’s assets, including the cash in Company B’s bank accounts. Post the acquisition, the cash in Company B’s bank accounts now belongs to Company A. This is “Cash Acquired”. This acquired cash effectively reduced the net amount of cash Company A spent to acquire Company B.

For instance, suppose Company A paid $100 million to acquire Company B. Company B has a bank account with $20 million of cash. After the acquisition, Company A owns Company B, including the $20 million of cash in the bank.  While Company A paid $100 million of cash to buy Company B, it later gained ownership over $20 million. Therefore, Company A effectively only spent $80 million to acquire Company B. The $100 million is “Acquisitions”. The $20 million is “Cash Acquired”. And the $80 million is “Acquisitions, Net of Cash Acquired”.

Companies pay cash upfront to acquire other companies but receives some cash in return. Therefore, accounting requires companies to net out the acquired cash. That’s why the name includes “Net of Cash Acquired”.

Example on the Cash Flow Statement

“Acquisitions, Net of Cash Acquired” is a very common line item on the Cash Flow Statement. It appears under Cash Flow from Investing. Sometimes, this line may appear as “Business Acquisitions”, “Payments Made in Connection with Acquisitions” or other similar variations. Because it represents cash outflow, it usually appears on the statement as a negative number. Here’s an example of Amazon’s Cash Flow Statement.

Acquisitions, Net of Cash Acquired Example Amazon

This line is distinct and separate from “Purchases of Marketable Securities”. “Purchases of Marketable Securities” represents the amount of cash a company invested in liquid securities, such as stocks and bonds. It’s merely investing some of its cash in securities instead of keeping it in the bank to earn better returns. These securities make up a minuscule percentage of other companies. In an acquisition, however, the company spends cash to purchase the entirety or close to entirety of another company.

Financial Implications of “Acquisitions, Net of Cash Acquired”

When the acquiring company buys a target company and gains control, it must consolidate the target company’s financials. Consolidation requires the acquiring company to include the target’s financials in its own financials. For example, suppose the acquiring company has $3 million revenue and the target company has $1 million. Consequently, the acquirer has to consolidate the financial statements and report $4 million in revenue.

As a result, there are important implications of “Acquisitions, Net of Cash Acquired” on the financial statements. The mere existence of this line indicates that the company made acquisitions. This means that the numbers on the financial statements include the numbers from the target company. This could cause significant jumps in values on the Income Statement, Cash Flow Statement and the Balance Sheet. For instance, in the example above, revenue increased from $3 million to $4 million, which represents a 33% increase. Therefore, whenever you see “Acquisitions, Net of Cash Acquired”, know that some of the large jumps are attributable to acquisitions.

Conclusion

In conclusion, “Acquisitions, Net of Cash Acquired” measures the net amount of cash a company spent to acquire other companies. It usually appears on the Cash Flow Statement under Cash Flow from Investing as a negative number.

Additional Paid-In Capital

By Accounting 5 Comments

What is Additional Paid-In Capital (APIC)?

Additional Paid-In Capital (APIC) represents the cumulative money investors paid in excess of stock’s Par Value in a primary market. We cover APIC in our Course 10, Lesson 24.

APIC is reported as a separate line item under the Shareholder’s Equity section of a company’s Balance Sheet. It typically appears alongside other equity line items, such as Retained Earnings and Common Stock Par Value.

APIC can have a significant impact on a company’s financial health and performance. Remember, APIC tracks money shareholders invested into the company. The company can use this cash to fund growth initiatives, such as Research & Development or Capital Expenditures. This, in turn, can help a company increase its market share, generate higher revenues, and improve profitability over time.

How APIC Gets Created

Notice the emphasis on primary market in the definition above. Buying in the primary market means that the investor is buying shares directly from the company. The investor’s money goes into the company’s bank account and the company’s shares goes into the investor’s brokerage account. By contrast, the buying and selling most of us see on the stock market are in the secondary market. Investors are buying from and selling to other investors. The cash does not go into the company’s bank account.

APIC is part of the Shareholder’s Equity section because it represents money that shareholders injected into the company. Emphasis on the word “injected”.

When us regular people buy stocks in the stock market, the money doesn’t go into the company’s bank account. We buy it from other shareholders so our money go to them and their shares come to us. But when investors buy shares directly from the company, they are effectively injecting money into the company.

APIC helps measure how much money investors injected into the company. In other words, when shareholders inject money into the company, it creates APIC.

Additional Paid-In Capital Formula

Here’s how to calculate Additional Paid-In Capital. In every transaction in the primary market, there’s an Offering Price (how much investors pay for each share), Par Value per Share (explained below), and Shares issued (the number of shares the company is selling to investors).

The product of Shares Issued and the difference between the Offering Price and the Par Value per Share equals APIC.

Additional Paid-In Capital Formula

Par Value per Share

The Par Value of common stock is a small made-up number that companies can set discretionarily. It’s a made-up number. Basically, when you set up a corporation, you state will ask you to assign a paper value to each stock. You usually pick some small number, such as $0.01 or $0.00001 per share. For example, the Par Value of Tesla is $0.001. Why? Elon Musk probably liked it better than $0.01 or $0.000001. You can pick $0.0030313 if you want. It’s a made-up number. Well, you might ask, what’s the point then? You can think of this as a stale, ancient, out-of-date practice in today’s age but very inconvenient to change. As a result, the practice of assigning Par Value to each stock still exist today.

Market Price per Share

The Market Price of common stocks is the stock price we see in the stock market. If you open any apps or news and you see the stock price of a stock, that’s the Market Price.

When investors purchase shares of a company’s stock in the primary market, they pay the Offering Price for the shares.  The Offering Price is usually slightly lower than the Market Price.

Additional Paid-In Capital Example

Let’s say Company A issues 1,000 shares of common stock. Offering Price is $5 per share and Par Value is $1 per share.

This means investors injected $5,000 cash into Company A ($5 per share x 1,000 shares). The total par value of the stock is $1,000 (1,000 Shares x $1 Par Value per Share). Therefore, the amount of money investors paid in excess of par value is $4,000 ($5,000 – $1,000).

To record this transaction on the Balance Sheet, Company A would record $1,000 of Common Stock Par Value and $4,000 of Additional Paid-In Capital.

Over time, as Company A continues to issue and sell shares of common stock, APIC would increase. APIC can also be affected by other transactions, such as the issuance of preferred stock or the exercise of stock options.

Tesla Additional Paid-In Capital

Let’s take a look at Tesla’s Additional Paid-In Capital. Here’s Tesla’s 2022 10-K. You can see that it has $3 million Par Value and $32,177 million Additional Paid-In Capital. Therefore, we can calculate investors invested a total of $32,180 million into Tesla.

Additional Paid-In Capital Tesla Example

Difference Between “Additional Paid-In Capital” and “Paid-In Capital”

Long story short, Paid-In Capital = Additional Paid-In Capital + Par Value.

Paid-In Capital (PIC) refers to the total amount of money shareholders invested into a company in a primary market. It includes both the par value of the stock and any additional funds paid above the par value. Balance Sheets usually don’t have a line for PIC. They usually only report Par Value and APIC. However, you can simply calculate this number by adding Par Value and APIC.

On the other hand, Additional Paid-In Capital (APIC) is a subset of PIC. Recall that APIC represents the cumulative money investors paid in excess of stock’s Par Value in a primary market.

Naturally, the sum of Additional Paid-In Capital and Par Value equals Paid-In Capital.

Impact of Stock Price Movements on APIC

Remember that APIC gets created from stock issuances in the primary market? It gets created when investors buy shares directly from the company, thereby putting cash directly into the company. Thereafter, as the stock trades publicly on the stock market, it has nothing to do with APIC. Therefore, stock price movements do not affect APIC.

However, because Offer Price in stock issuances is usually slightly below Market Price, as stock prices change, it will affect the Offer Price at which future shares are issued, and this can affect future APIC.

Learn More About APIC

At Lumovest, we’re building the place where anyone can learn finance and investing in an affordable and easy-to-understand manner. Our courses are far more intuitive, visualized, logical and colloquial than your college professor-taught courses. Our courses are taught by Goldman Sachs investment banker who has worked on transactions worth over $50 billion. We designed our courses to prepare you to succeed in the world of high finance. You’ll learn how to conduct financial analysis exactly like how it’s done on Wall Street’s top firms. Upon completion of the courses, you will receive our Global Financial & Investment Analyst (GFIA) certification. You can sign up here.

Adjusted EBITDA

By Accounting 2 Comments

What is Adjusted EBITDA?

Adjusted EBITDA is a non-GAAP metric that measures a company’s normalized cash profits. Adjusted EBITDA is essentially EBITDA plus or minus adjustments. These adjustments usually include non-cash items in addition to D&A (i.e. Stock-Based Compensation), non-recurring items, and run-rate adjustments.

This metric is usually used in financial analysis for valuation and debt covenant purposes.

AIDA Model

By Management & Strategy No Comments

What is AIDA Model in Marketing?

The AIDA model is an advertising framework reflecting the 4 stages that consumers go through in the purchase process. AIDA stands for Attention, Interest, Desire, and Action. The model is based on the idea that a successful advertisement should first grab a viewer’s attention, then spark their interest in the product or service being advertised, create a desire for the product, and finally lead to a call to action.

The AIDA model was first developed by E. St. Elmo Lewis in the late 1800s. It was later popularized by advertising executive and author, Claude Hopkins, in his 1923 book, “Scientific Advertising.”

The AIDA model is used for a wide range of advertising campaigns, from TV commercials and print ads to online marketing efforts. By following the framework of AIDA, marketers can craft ads that are more likely to grab the attention of their target audience, generate interest in their products, and ultimately drive sales.

Using the AIDA model can also help marketers measure the effectiveness of their advertising campaigns. By tracking metrics such as click-through rates, conversions, and sales, they can see how well their ads are performing and make changes as needed to improve their results.

In other words, the AIDA model is a powerful tool for marketers to create effective advertising campaigns. By following its framework of attention, interest, desire, and action, marketers can create ads that capture the attention of their target audience, generate interest in their products, and ultimately lead to more sales. Now let’s dive deep into each of the 4 steps in the AIDA hierarchy.

AIDA Model
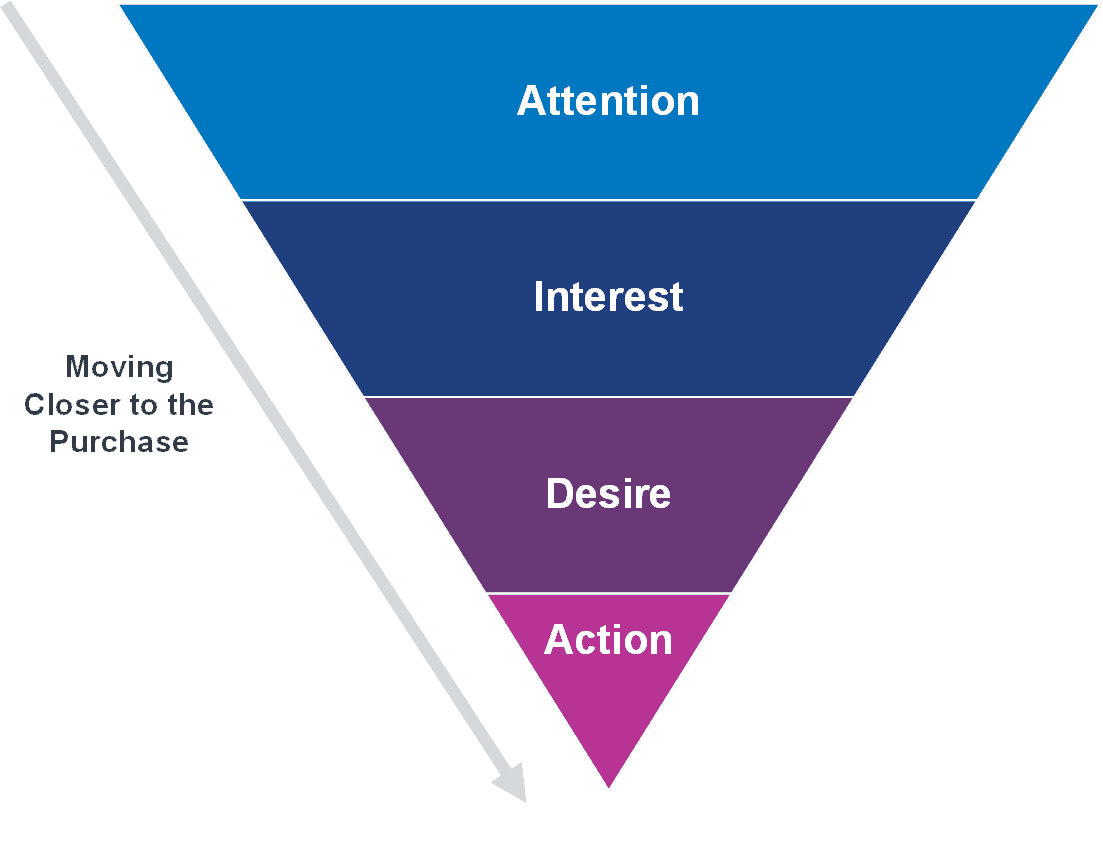
First Step: Attention
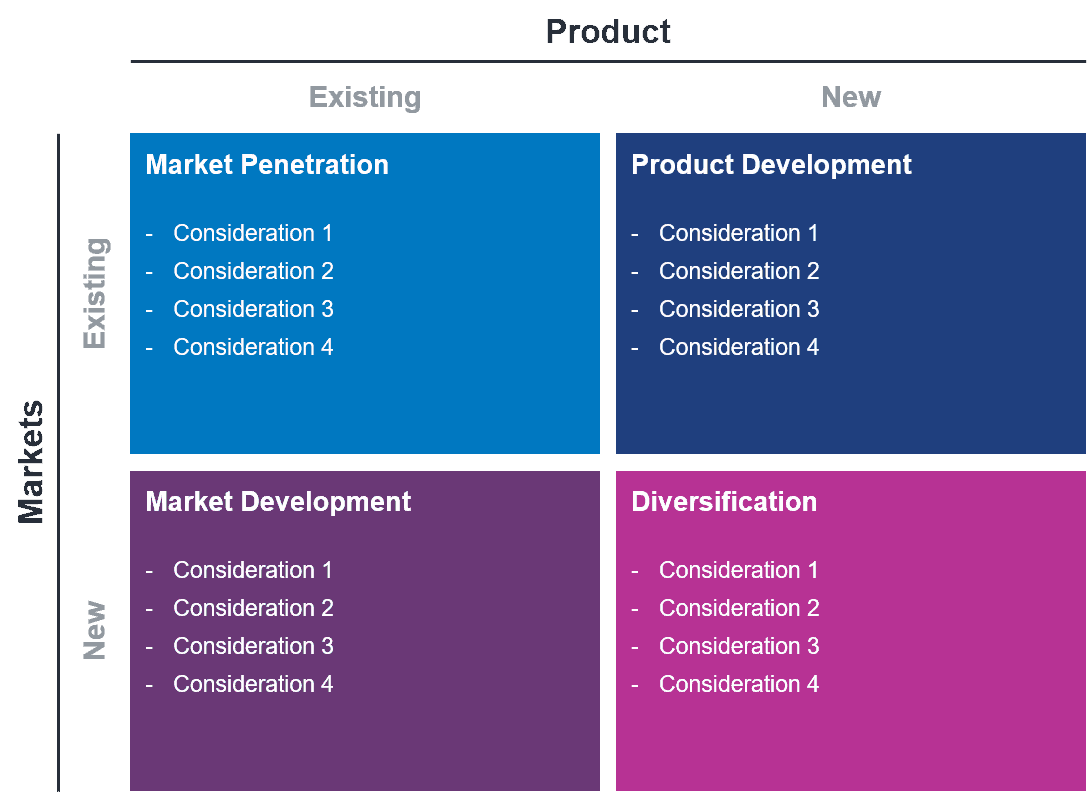
The first step in the AIDA model is to capture the Attention of the target audience. This step involves creating an impactful and memorable message that will grab the attention of the audience and make them interested in the product or service being advertised.

To achieve this, marketers use a variety of techniques, such as creative visuals, unique slogans, and compelling narratives. The message should be relevant and appealing to the target audience, and it should highlight the benefits of the product or service being advertised.

In this step, it’s important to remember that the attention span of most consumers is short, so the message needs to be delivered quickly and effectively. Marketers may use different platforms and channels to capture the audience’s attention, such as TV commercials, billboards, social media ads, or email marketing campaigns.

The Attention step is crucial because it sets the foundation for the rest of the AIDA model. If the message fails to capture the audience’s attention, the rest of the marketing effort will likely be ineffective. Therefore, it’s important for marketers to invest time and resources into creating a compelling and attention-grabbing message.

One way to enhance the effectiveness of the Attention step is to conduct market research to gain insights into the target audience’s interests, preferences, and needs. This information can be used to create a message that resonates with the audience and captures their attention.

AIDA Model Example: Attention

One example of an advertisement that effectively used the Attention step in AIDA is the Old Spice commercial titled “The Man Your Man Could Smell Like.” In this ad, a shirtless, muscular man speaks directly to the camera while showcasing various Old Spice products. The commercial is attention-grabbing due to its unexpected humor and the unconventional way the product is presented. The use of a confident and attractive man helps to catch the viewer’s attention, and the humorous dialogue keeps them engaged. Additionally, the ad makes use of vibrant colors, lively music, and quick transitions between different scenes, which further adds to its overall impact. This commercial was incredibly successful, generating millions of views on YouTube and ultimately increasing sales for Old Spice. It is a great example of how the attention step in AIDA can be effectively utilized in advertising.

Second Step: Interest

The “Interest” step in the AIDA model is all about capturing the attention of the audience and then piquing their interest with the ad’s content. Once you’ve grabbed their attention, the next step is to keep them interested by providing them with relevant and useful information.

One effective way to generate interest is by focusing on the benefits of the product or service being advertised. Showcasing the unique features of the product, how it can solve a problem or meet a need, or how it can enhance the audience’s life can all help generate interest.

Another approach is to appeal to the audience’s emotions. Emotional appeals can be very effective in capturing and holding the audience’s attention. Whether it’s using humor, telling a story, or tapping into the audience’s fears or desires, evoking emotions can be a powerful tool in generating interest.

It’s also important to keep the messaging clear and concise. The ad should be easy to understand and not overload the audience with too much information. The goal is to create curiosity and interest, not overwhelm them.

AIDA Model Example: Interest

One example of an advertisement that effectively uses the “Interest” step in the AIDA model is Apple’s “Think Different” campaign. The ad features a series of famous innovators and thinkers, including Albert Einstein and Martin Luther King Jr., and challenges the audience to think differently and embrace creativity.

The ad captures the audience’s attention with its striking visuals and famous personalities, but it’s the messaging that generates interest. By appealing to the audience’s desire for innovation and creativity, the ad creates a sense of excitement and possibility. It also showcases Apple’s brand values and positions the company as a leader in the technology industry.

Third Step: Desire

In the Interest stage, the goal is to capture the audience’s attention and get them engaged. This can be done through attention-grabbing headlines, images, or messaging that addresses their pain points or interests. The focus is on creating intrigue and sparking curiosity in the product or service.

In the Desire stage, the goal is to turn that interest into a strong desire for the product or service. This is where the marketer needs to provide specific information and details that address the audience’s needs, wants, and desires. This could be done through highlighting unique features or benefits of the product, providing social proof, or demonstrating how the product or service can solve their problem or improve their life.

To build Desire, marketers need to focus on creating an emotional connection with the audience. This can be done by telling a compelling story or providing an aspirational vision of what their life could be like with the product or service. The goal is to create a sense of urgency and make the audience feel that they need the product or service in their life.

AIDA Model Example: Desire

One example of an advertisement that effectively turned interest into desire using the AIDA model is the “Got Milk?” campaign from the 1990s.

The campaign featured various celebrities and athletes with milk mustaches, asking the question “Got Milk?” This created initial attention and interest from the audience, as the ads were eye-catching and often humorous.

But the campaign didn’t stop at just grabbing attention and generating interest. The ads went on to highlight the benefits of drinking milk, such as strong bones and teeth, as well as how it can help refuel after exercise. By focusing on these benefits, the ads aimed to create a desire for milk in the audience.

The campaign also included interactive elements, such as contests and promotions, that encouraged people to engage with the brand and try out the product for themselves. This helped to further build desire and reinforce the message that milk was a valuable addition to one’s diet.

Fourth Step: Action

The “Action” step is the final stage in the AIDA model, motivating the consumer to take action.

In this step, the advertisement aims to encourage the consumer to make a purchase, take a specific action, or contact the company. The advertisement needs to provide clear instructions on what the consumer needs to do next, such as “call now,” “visit our website,” or “order today.”

The advertisement should also create a sense of urgency to prompt the consumer to take immediate action. For example, a limited-time offer or a time-limited discount can encourage consumers to act quickly.

In order to be effective, the action step must be clear, simple, and easy to follow. The consumer should not be confused about what they need to do next or be presented with too many options. The action step should also be easily accessible, whether it is through a website, phone number, or physical location.

AIDA Model Example: Action

Have you see those car dealership advertisements on TV?

These car dealership advertisements often come with the call to action “visit our showroom for a test drive today” after building Interest and Desire with features and benefits of the car.

In this example, the car dealership advertisement effectively builds Interest and Desire by highlighting the features and benefits of the car in the Attention and Interest steps of AIDA. In the Desire step, the advertisement may evoke emotions by showing the car in an aspirational setting, such as a scenic road trip or a family outing. Finally, in the Action step, the advertisement uses a clear call to action by inviting the viewer to visit the showroom for a test drive, which can lead to a purchase.

By including a call to action, the advertisement encourages the viewer to take the next step in the buying process, which can ultimately lead to a conversion. The call to action is clear, specific, and actionable, making it easy for the viewer to follow through.

Astutely, the car dealer doesn’t say “visit our showroom to buy a car today”. That’s too much of a commitment. But a free test drive? That’s low commitment and a lot of people are interested in that.

Overall, this car dealership advertisement is an effective example of how the Action step in AIDA can be used to guide a viewer towards a specific action, such as visiting a showroom, making a purchase, or signing up for a service.

Learn More

At Lumovest, we’re building the place where anyone can learn finance and investing in an affordable and easy-to-understand manner. Trust us, our courses are far more intuitive, visualized, logical and colloquial than your college professor-taught courses. Our courses are taught by Goldman Sachs investment banker who has worked on transactions worth over $50 billion. We designed our courses to prepare you to succeed in the world of high finance. You’ll learn how to conduct financial analysis exactly like how it’s done on Wall Street’s top firms. Upon completion of the courses, you will receive our Global Financial & Investment Analyst (GFIA) certification. You can sign up here.

Ansoff Matrix

By Management & Strategy No Comments

What is the Ansoff Matrix?

The Ansoff Matrix is a business strategy framework that helps companies to identify new opportunities for growth. It was developed by Igor Ansoff, a Russian-American mathematician, and business theorist in 1957.

The matrix has two axes: Products (Existing Products & New Products) and Markets (Existing Markets & New Markets). The intersection of these two axes forms four different strategies.

Ansoff Matrix Template


  1. Market Penetration: This strategy involves selling more existing products in existing markets. Market Penetration is a low-risk strategy that is suitable for companies that are looking to increase their market share in existing markets.
  2. Market Development: This strategy involves introducing existing products to new markets. Market Development is a higher-risk strategy that requires companies to enter new markets.
  3. Product Development: This strategy involves creating new products for existing markets. Product Development is also a higher-risk strategy that requires companies to invest in research and development to create new products.
  4. Diversification: This strategy involves creating new products for new markets. Diversification is the highest-risk strategy as it involves creating new products for new markets.

Companies can use the Ansoff Matrix to assess their current position and determine which strategy is the best fit for their business. This framework helps companies to identify potential risks associated with each strategy and determine the best course of action.

By using the matrix, companies can develop a growth strategy that aligns with their resources, capabilities, and objectives. In the rest of this article, we’ll learn to understand the Ansoff Matrix in greater detail and go over real company examples.

Ansoff Matrix Template

Here’s a PowerPoint Ansoff Matrix template that you can download.

Market Penetration

Market Penetration is a growth strategy where companies focus on increasing sales of existing products in current markets. Companies can achieve this through the following tactics.

  1. Pricing: Adjust their pricing strategy to make products more affordable.
  2. Promotion: Increase their marketing efforts to create more brand awareness.
  3. Distribution: Expand distribution channels to reach more customers.
  4. Experience: Improve customer service to enhance customer satisfaction and loyalty.
  5. Product: Enhance the product features or add new product lines to meet customer needs and preferences.

By implementing these tactics, companies can drive more sales and capture a larger share of the market. This approach is often less risky than pursuing new products or new markets, as the company is building on its existing strengths and market presence.

Market Penetration can be especially useful for companies that have a strong brand, a loyal customer base, and established distribution channels. By improving these elements, the company can attract new customers and retain existing ones. However, it is important for companies to carefully analyze their pricing, marketing, and distribution strategies to ensure that they are maximizing their potential for growth.

One example of a company that implemented the Market Penetration strategy is McDonald’s. McDonald’s increased its market share by opening more restaurants in existing markets, expanding menu offerings, and promoting heavily through advertising campaigns. By targeting new and existing customers with discounts, meal deals, and promotions, McDonald’s has successfully increased sales and profits. It also continuously evaluates and adjusts pricing strategy to remain competitive in the market. For example, it introduced the Dollar Menu to attract price-sensitive customers while also offering premium items to cater to those looking for higher-end options. McDonald’s successful implementation of the Market Penetration strategy contributed to its status as one of the world’s most recognized fast-food chains.

Market Development

Market Development is a strategy that involves selling existing products to new markets. It is one of the four growth strategies identified by the Ansoff Matrix. Companies can use this strategy to expand their customer base and increase their revenue. To achieve Market Development, companies can consider the following tactics.

  1. New Geographical Markets: Companies can expand into new geographical regions to reach new customers. This can involve setting up new sales channels or partnering with local distributors.
  2. New Demographic Segments: Companies can focus on reaching new demographic groups by adapting their marketing and messaging to specific age groups, ethnicities, or other demographic factors.
  3. New Market Niches: Companies can explore new market niches by adapting their existing products to meet the specific needs of new customer groups.
  4. Expand Distribution Channels: Companies can increase their sales by selling their products through new distribution channels, such as online marketplaces or partnering with other companies to bundle their products.
  5. Modify Product Functions: Companies can modify existing products to better meet the needs of the new market.

One example of a company that implemented the Market Development strategy is Starbucks. They expanded to new markets such as China, India, and Brazil to increase sales revenue. They also introduced new products beyond coffee, such as Teavana tea and Evolution Fresh juices. By doing so, Starbucks was able to reach out to new customers in these markets and increase their overall customer base.

Product Development

Product Development is one of the four strategies in the Ansoff Matrix, which involves developing new products or improving existing ones to cater to the needs of the existing market. This strategy is aimed at expanding the customer base and improving the product range.

To implement the Product Development strategy, a company needs to focus on research and development, design, and marketing. The company needs to identify new product opportunities and conduct market research to understand customer needs and preferences. This helps the company to identify gaps in the market and develop products that fill those gaps.

A company can also use the following approaches to implement the Product Development strategy.

  1. Develop Products that Complement Existing Ones: A company can develop products that complement its existing products. This can help to increase customer loyalty and sales.
  2. Improve Existing Products: A company can improve its existing products by adding new features or upgrading them. This can help to attract new customers and retain existing ones.
  3. Introduce New Products: A company can introduce completely new products that cater to the needs of the existing market. This can help to expand the customer base and increase sales.

One example of a company that implemented the Product Development strategy is Apple. In 2007, it released the first iPhone, which significantly deviated from its usual focus on personal computers and iPods. After the success of the iPhone, Apple continued to innovate with the release of the iPad in 2010. This created a new market for tablet devices. The company also continued to improve upon existing products, releasing new features and designs. Through its focus on product development, Apple was able to continuously provide consumers with new and innovative products. This strategy has been a key driver of Apple’s success and growth.

Diversification

Diversification is one of the four strategies in the Ansoff Matrix. It involves introducing a new product or service in a new market. Diversification can be risky, but can also be a way for a company to grow and increase profitability.

There are two types of diversification: Related and Unrelated.

Related Diversification involves introducing a new product or service related to the company’s existing products or services. This helps a company leverage its existing brand, customer base, and distribution channels. For example, a clothing company that introduces a line of accessories can leverage its existing brand recognition and customer base to increase sales.

Unrelated Diversification involves introducing a new product or service not related to the company’s existing products or services. Unrelated diversification can be riskier, but can also lead to greater rewards. For example, a food company that enters the pet food market can potentially tap into a new and growing market.

Companies can also achieve Diversification through mergers and acquisitions. This allows a company to quickly enter a new market and gain access to new products or services. Our courses at Lumovest teach you how to perform in-depth M&A analysis to support this business strategy.

Google is a great example of a company that implemented Diversification strategy. Initially, it started as a search engine company. However, it diversified into other areas such as email services, mobile operating systems, and smart home technology. Google also invested in startups and acquired companies such as YouTube, Nest, and Android to further diversify its offerings. This allowed Google to expand its market reach and tap into new revenue streams while also reducing its reliance on any one product or service. Through Diversification, Google became one of the world’s largest technology companies, with a diverse portfolio of products and services.

Ansoff Matrix Example

Let’s take the example of Amazon and see how it used the Ansoff Matrix to design growth strategy.

Market Penetration: Amazon has implemented this strategy by increasing its market share through competitive pricing, Amazon Prime membership, and customer service. The company has also expanded its product line to include groceries, electronics, and other consumer goods. Amazon has also increased its online presence through digital marketing and social media campaigns.

Market Development: Amazon expanded into new geographical markets by opening online stores in different countries. Amazon India and Amazon China are examples of this strategy. The company also launched Amazon Business, which caters to small and large businesses, to expand its reach in the B2B market.

Product Development: Amazon constantly adds new features and products to its existing portfolio. Amazon Alexa and Amazon Go are some examples of innovative products the company has developed. The company has also expanded into the entertainment industry with Amazon Prime Video and Amazon Music.

Diversification: Amazon has diversified into new markets with the acquisition of Whole Foods, Ring, Twitch, and other companies. These acquisitions have allowed Amazon to expand its business beyond e-commerce and into new industries.

Ansoff Matrix Advantages and Disadvantages

Ansoff Matrix is a widely used tool for strategic planning, but it also has its advantages and disadvantages.

Advantages

  1. Helps Identify Growth Opportunities: The Ansoff Matrix helps companies to identify growth opportunities and make informed decisions about where to invest their resources.
  2. Provides a Structured Approach: The matrix provides a structured approach to strategic planning, making it easier for companies to develop and implement growth strategies.
  3. Assists in Risk Assessment: The matrix enables companies to assess the risks associated with different growth strategies and make more informed decisions.
  4. Enhances Communication and Collaboration: The matrix facilitates communication and collaboration among team members by providing a common language for discussing growth strategies.

Disadvantages

  1. Limited Perspective: The Ansoff Matrix focuses solely on product and market factors, neglecting other important factors like competition, technology, and customer behavior.
  2. Ignores External Factors: The matrix ignores external factors like economic conditions, political environment, and social trends, which can have a significant impact on business growth.
  3. Simplistic Approach: The matrix oversimplifies the complexity of strategic planning and may not be suitable for all companies.
  4. Lacks Quantitative Analysis: The matrix does not incorporate quantitative analysis, making it difficult to measure the effectiveness of growth strategies.

While the Ansoff Matrix can be a useful tool for strategic planning, it should be used in conjunction with other tools and approaches to develop a comprehensive growth strategy.

Learn More

At Lumovest, we’re building the place where anyone can learn finance and investing in an affordable and easy-to-understand manner. Trust us, our courses are far more intuitive, visualized, logical and colloquial than your college professor-taught courses. Our courses are taught by Goldman Sachs investment banker who has worked on transactions worth over $50 billion. We designed our courses to prepare you to succeed in the world of high finance. You’ll learn how to conduct financial analysis exactly like how it’s done on Wall Street’s top firms. Upon completion of the courses, you will receive our Global Financial & Investment Analyst (GFIA) certification. You can sign up here.

Average Revenue per User (ARPU)

By Accounting No Comments

What is Average Revenue per User (ARPU)?

Average Revenue Per User (ARPU) is a financial metric that measures how much revenue on average each user generates. ARPU evaluates the revenue generation performance of companies that provide subscription-based services. We can calculate ARPU by dividing the total revenue by the number of users or subscribers during the same period.

For example, let’s say a streaming service provider has 1 million subscribers and generates $10 million in revenue. To calculate its ARPU, we would divide the $10 million by 1 million, giving us an ARPU of $10. This means that on average, the company earns $10 from each user.

ARPU can be calculated for any type of subscription-based business. Some examples include streaming services, mobile applications, and software-as-a-service (SaaS) providers. It is a valuable metric for investors and analysts because it provides insight into the monetization performance of these businesses.

Why is ARPU Important?

ARPU is an important metric for businesses that offer subscription-based services because it provides insight into the company’s monetization ability. By tracking ARPU over time, companies can assess whether their pricing strategy is effective, and whether they are successfully increasing revenue through the acquisition of new subscribers or the retention of existing ones.

Average Revenue per User can also help companies understand their customer base and identify opportunities for growth. For example, if a company has a high ARPU relative to competitors, it may indicate that its customers are willing to pay more for its products or services. Conversely, if a company has a low ARPU relative to competitors, it may indicate that it’s underpricing its products or for whatever reason, customers aren’t willing to pay more.

Take, for example, Netflix and Disney. In the quarter ended September 2022, Netflix reported $11.85 of ARPU among its global viewers (page 20). In the same period, Disney+ reported only $3.91 of ARPU among global viewers (page 6). This indicates that Disney’s ability to monetize its viewers is weaker than that of Netflix. This could be due to customers not willing to pay the same price for Disney+. It could also be due to Disney undercharging customers. The ARPU metric can help the analyst identify the gap between Netflix and Disney. However, it’s up to the analysts to identify the cause, which will then become part of their investment thesis.

ARPU is also important because it’s a driver of revenue. Mathematically, ARPU times number of users equals total revenue. Naturally, to increase revenue, companies must increase ARPU, number of users, or ideally both. Thus, we can see that ARPU is an essential driver of revenue. As we explain in Course 4 of our curriculum, revenue growth is absolutely critical in investment analysis.

ARPU Formula

How do we calculate ARPU? Here’s the formula.

Average Revenue Per User (ARPU) Formula

For example, if a company has $100 million in revenue and 200,000 users, then it has $500 ARPU.

By now, you should understand that ARPU is a very important metric. Perhaps due to its importance and popularity, there are now many variations of this formula.

The first variation is Average Revenue per Paying User. Instead of dividing total revenue by all users, this variation divides total revenue solely by paying users. It completely excludes non-paying users.

The second variation is to calculating Average Recurring Revenue per User. Instead of calculating ARPU off of total revenue, this variation uses the amount of revenue that’s recurring in nature. It excludes non-recurring revenue.

There are many other variations as well, but they’re largely conceptually similar. For example, another variation is to divide total revenue by active users only instead of all users. While some companies present annual ARPU, other companies calculate monthly ARPU.

Regardless the variation, the underlying concept is the same – it measures a company’s monetization ability.

Industries That Use ARPU

ARPU is commonly used in industries that offer subscription-based services. In these industries, customers pay a recurring fee for access to products or services. Some examples of industries that use ARPU are as follows.

  • Streaming Services: Streaming services such as Netflix, Hulu, and Disney+ use ARPU to measure the revenue generated from their subscribers.
  • Telecommunications: Telecommunication companies such as AT&T and Verizon use ARPU to track revenue generated from mobile phone subscribers.
  • Video Games: Video game companies such as Electronic Arts and Activision Blizzard use ARPU to measure the revenue generated by their player base, particularly in games that offer subscription-based services or in-game purchases.
  • SaaS Providers: Software-as-a-service (SaaS) providers such as Salesforce and Adobe use ARPU to track the revenue generated by their subscribers. Software subscribers pay for access to cloud-based software products.
  • Music Streaming: Music streaming services such as Spotify and Apple Music use ARPU to measure the revenue generated from their subscribers who pay for access to ad-free streaming and other premium features.

Overall, ARPU is a widely used metric that helps businesses and investors understand the revenue model. It helps them understand the company’s monetization and identify opportunities for growth and optimization.

How to Increase ARPU

As explained above, ARPU is particularly important because it’s a driver of revenue. ARPU times number of users equals revenue. Naturally, companies want to increase their ARPU as part of the effort to increase revenue.

But how can companies increase ARPU? Here are some levers companies can pull to increase Average Revenue per User.

First, companies can increase price. Assuming volume doesn’t decline materially, increasing price will increase ARPU. Some companies can simply increase prices because they’re currently underpricing their offerings. As a result, their products appear as a “steal” to users. For other companies, they may need to roll out new features to justify the price increase.

Second, companies can encourage users to buy the more expensive plans instead of the cheaper plans. This changes the revenue mix and the higher priced plans will lift up ARPU. For example, take a look at Adobe’s pricing plans below.

Adobe Pricing Plans ARPU

Adobe can try to convince more paying customers to buy the “Creative Cloud All Apps” instead of “Single App”. This will shift revenue mix towards more expensive plans and increase ARPU.

Third, companies can add add-on premium features for purchase. For example, game producers often have items in games that users can purchase. This is in addition to whatever base price that the user is paying (if any).

And lastly, companies can try to attract more affluent users. These customers are less price sensitive and winning over this customer segment can significantly boost revenue.

Learn More

At Lumovest, we’re building the place where anyone can learn finance and investing in an affordable and easy-to-understand manner. Our courses are far more intuitive, visualized, logical and colloquial than your college professor-taught courses. Our courses are taught by Goldman Sachs investment banker who has worked on transactions worth over $50 billion. We designed our courses to prepare you to succeed in the world of high finance. You’ll learn how to conduct financial analysis exactly like how it’s done on Wall Street’s top firms. Upon completion of the courses, you will receive our Global Financial & Investment Analyst (GFIA) certification. You can sign up here.

Balance Sheet

By Accounting No Comments

What is a Balance Sheet?

The Balance Sheet is one of the three main financial statements that we use to analyze a company. It shows a company’s assets (what the company owns), liabilities (what it owes), and equity (value left over for the company owners) as of a specific point in time. The Balance Sheet as a financial report that tells you the company’s net worth at a specific point in time. Logically, a company is made up of all the assets it owns and liabilities it owes. Therefore, the Balance Sheet is a critical component in financial analysis. All of the high paying finance jobs require a solid understanding of the Balance Sheet. Here’s what a Balance Sheet looks like:

Balance Sheet Example Image

Through this article, we’ll develop a strong understanding of Balance Sheet. First, we’ll look at an example of a real Balance Sheet for a real company. Second, we’ll learn how the Balance Sheet is structured and the common line items. Third, we’ll learn the accounting principles that underpin the Balance Sheet. These accounting principles form the basis that determine the values on the Balance Sheet. And finally, we’ll learn about the key insights we can derive from a Balance Sheet. That is, what the Balance Sheet tells you about a company.

Balance Sheet Example

Here’s a real Balance Sheet for Hershey (NYSE: HSY), the maker of the famous Hershey’s chocolate. You can find the Balance Sheet on PDF page 57 of the company’s annual report.

Real Balance Sheet Example Image

There are a few things to note here.

First, notice that the Balance Sheet is explicitly labeled as “Consolidated” Balance Sheet. This is standard among American companies. Under US GAAP, companies have to report “consolidated” financial statements. To consolidate financials means to combine the financials from all the entities and subsidiaries that the company controls. So “Consolidated” Balance Sheet means the company is including everything that it controls in the financials.

Second, pay attention to the fact that companies clarify the unit metrics for the Balance Sheet at the top. In Hershey’s case, the company is reporting the Balance Sheet values in thousands. The implication is that all the numbers on this statement should be read in thousands. So for example, the value of “Cash and Cash Equivalents” is $587,998. This means it’s $587,998 thousand or $587 million and $998 thousand.

A common mistake among beginners is to read the numbers exactly as stated and neglect the unit metrics. Unit metrics is very common for financial statements of large companies, especially those that are publicly traded. This rounding guides analysts to focus on the important digits. It also makes the Balance Sheet much more appealing to read. Therefore, the first thing you should do anytime you analyze a Balance Sheet is to check the unit metrics. This will enable you to understand the true scale of the numbers.

And third, notice that the Balance Sheet pinpoints the exact date. This brings us to our third point about the Balance Sheet: the time period.

Balance Sheet Time Period

The Balance Sheet differs from the other financial statements in the time period on which it reports the values. Whereas the Income Statement and the Cash Flow Statement shows how the company has performed financially over a period of time, the Balance Sheet shows the financials at a specific point in time. The Income Statement and the Cash Flow Statement might show you the amount of money earned from 1/1 through 12/31. The Balance Sheet, however, will tell you how much assets and liabilities it has on 12/31. For this reason, some people refer to the Balance Sheet as a snapshot of the company’s financial position. That’s why the Balance Sheet is also known as the Statement of Financial Position.

The Balance Sheet enables us to understand the company’s latest financial position at the time we’re performing our analysis. Collectively, the financial statements are saying: given how much money the company made and how much money it spent over last year (Income Statement and Cash Flow Statement), here’s what the company owns and what it owes at the end (Balance Sheet).

The Balance Sheet Equation

The Balance Sheet is structured with three main sections: Assets, Liabilities, and Equity. On Balance Sheets, companies will show the Assets section first, Liabilities second and Equity last.

Assets = Liabilities + Equity

Conceptually, whatever value of assets is left after paying for the value of liabilities belongs to the owners. Therefore, Assets equals the sum of Liabilities and Equity. This is known as the Accounting Equation. The total value of Assets must be the same as the total value of Liabilities and Equity. The two numbers must be the same so that the Balance Sheet “balances”. The Balance Sheet is predicated on this Accounting Equation.

Balance Sheet Format

Balance Sheet Assets Layout Image

Within the Assets section, companies will further sub-categorize their various assets by Current Assets and Long-Term Assets. Current Assets are those that can be converted into cash within one year. Long-Term Assets are those that cannot be converted into cash within one year. The ability to convert assets into cash is known as liquidity. The items in the Assets section are ordered based on decreasing liquidity. In other words, the assets that can be most easily converted into cash are listed first. Those that are most difficult to convert into cash are listed last. Naturally, items in the Current Assets section are ordered before Long-Term Assets.

Balance Sheet Assets + Liabilities Layout Image

Similar to the Assets section, companies will also further sub-categorize what they owe by Current Liabilities and Long-Term Liabilities. Current Liabilities are those that require cash payments within one year. Long-Term Liabilities are those that do not require cash payments within one year. Current Liabilities are ordered before Long-Term Liabilities.

Balance Sheet Assets + Liabilities + Equity Layout Image

The Equity section starts with how much money the owners had originally invested into the company. It also includes the gains and losses on those money invested. Then it adjusts for the money investors had gotten back from the company. And lastly, it includes Non-Controlling Interest.

While companies will have minor differences in formatting and labeling, this overall structure is standard across companies. The Assets section comes first, followed by Liabilities and Equity. Within Assets section, items are ordered based on liquidity and sub-categorized into Current Assets and Long-Term Assets. Within Liabilities, items are ordered based on usage of cash and sub-categorized into Current Liabilities and Long-Term Liabilities. Now that we understand how the Balance Sheet is structured, let’s learn about the common line items.

Assets

Conceptually, an asset is anything that the company controls that has value, anything that benefits the company. The common assets that a company has are:

  1. Cash & Cash Equivalents

    This is the value of cash the company has on hand. The cash it has in the cash registers, the cash in the bank accounts, CDs, etc. Nothing is more liquid than cash. Therefore, Cash & Cash Equivalents is usually the first line on the Balance Sheet.

  2. Short-Term Investments

    This is the value of investments that can be easily sold and converted into cash within a year. They’re usually publicly-traded securities, such as stocks and bonds, that can be easily liquidated.

  3. Accounts Receivable

    This is the value of money that the company has yet to collect on goods and services already delivered. Said differently, this is the value of money that customers owe the company but not yet paid.

  4. Long-Term Investments

    Long-Term Investments are investments the company has made that cannot be sold and converted into cash within one year. They’re usually investments in privately-held companies. These investments can’t be liquidated without an extended sale process.

  5. Property, Plant & Equipment (PP&E)

    Property, Plant & Equipment (PP&E) relate to physical assets the company controls other than its inventory. PP&E includes things like land, factory buildings, machines, computers, desks, chairs, refrigerators, keyboards, telephones, shopping carts, trucks, etc.

  6. Intangible Assets

    Intangible Assets are assets that the company controls without a physical substance. Examples are brand, copyrights, patents, licenses, customer relationships, and trade secrets.

There are many other types of assets a company can have, but these are probably the most common ones. Now that we know the common assets a company may have, let’s learn about the common liabilities.

Liabilities

Conceptually, a liability is anything that has value that the company owes to other parties. The common liabilities that a company has are:

  1. Current Portion of Long-Term Debt

    This is the amount of money the company owes to lenders that has to be repaid within the year. The company may have borrowed a lot more, but only has to repay a portion of it within one year. Therefore, it’s called “Current Portion” of Long-Term Debt.

  2. Accounts Payable

    Accounts Payable represents the value of money the company owes to suppliers and other vendors for goods and services provided. Said differently, the company had purchased things from other companies but not yet paid for them.

  3. Deferred Revenue

    Deferred Revenue is the value of goods and services that the company owes to its customers. The customers have already paid the company in advance but the company has not yet delivered what the customers purchased.

  4. Long-Term Debt

    Long-Term Debt is the portion of the company’s total borrowings that isn’t due to be repaid within one year. They’ll eventually have to be repaid, just not within the next 12 months.

  5. Capital Lease

    Capital Lease represents the present value of future lease payments that the company has to make. It’s the money companies has to pay for whatever asset (i.e. office space, factory building, etc.) the company is leasing.

  6. Commitments & Contingencies

    Commitments are obligations of the company to perform something in the future. Example: Company signed a contract to buy $100 million of goods from a supplier. Contingencies are possible obligations that can take place based on uncertain future events. Example: Company is being sued for $20 million and the lawsuit is still pending.

Most companies will have other types of Current Liabilities. We go over detailed list of Current Liabilities in our online courses. Next, let’s go over the common line items that appear under the Equity section.

Equity

Conceptually, the Equity section shows (1) how much money the company’s owners had originally invested into the company, (2) how much gains and losses the company has made for the owners, (3) how much money the company had given back to the owners, and (4) Non-Controlling Interest. Here are the common line items:

  1. Common Stock (Par Value) and Additional Paid-In Capital (APIC).

    This is the amount of capital equity holders had invested into the company. Of the total investment, the bare minimum is recorded in Common Stock. Anything in excess of par is included in Additional Paid-In Capital.

  2. Retained Earnings

    Retained Earnings is the cumulative profit the company has earned for shareholders that hasn’t been paid through dividends yet. Said differently, Retained Earnings is the company’s cumulative profit that has not yet been distributed to the owners.

  3. Accumulated Other Comprehensive Income (AOCI)

    AOCI is the cumulative unrealized gains or losses that the company has earned from investments or other assets. The company has seen the value of its investments increase, but it hasn’t sold them yet. So the gains and losses aren’t realized yet.

  4. Treasury Stock

    On the Balance Sheet, this represents the value of money the company had spent to repurchase its stocks. It shows the amount of money the company had given back to the equity holders.

  5. Non-Controlling Interest (NCI)

    Non-Controlling Interest represents the value of Assets leftover after Liabilities that is NOT owned by the owners of the company. It’s previously known as Minority Interest.

  6. Shareholder’s Equity

    Shareholder’s Equity is the value of the assets the company controls leftover to company’s owners after covering all liabilities. It’s also known as the Book Value of Equity or simply Book Value.

For most companies, those are the only line items they’ll have. In fact, some might have less (i.e. many companies don’t have Non-Controlling Interest).

Balance Sheet Accounting Principles

We learned how the Balance Sheet is structured and the most common line items that appear on it. It’s time to learn about the key accounting principles that underpin the Balance Sheet. These accounting principles form the basis on which the values on the Balance Sheet are recorded. They standardize how companies determine the value of what they own and what they owe.

Balance Sheet Accounting Principles Image

Monetary Unit Principle:

The first principle underpinning the Balance Sheet is the Monetary Unit Principle. It states that only accounts that can be measured in monetary units can be recorded in the company’s financial statements. If something can’t be measured with money, it can’t be recorded on the Balance Sheet.

Stable Dollar Assumption:

The Stable Dollar Assumption is a premise that the currency used to prepare the financial statements is stable over time. It assumes no impact from inflation or deflation on the currency. Said differently, it assumes that the dollar today has same purchasing power as the dollar 20, 40 years ago.

Cost Principle:

The Cost Principle requires Assets, Liabilities and Equity items on the Balance Sheet to be recorded at their historical cost. Historical cost is defined as the value of money paid or received at the time of transaction (“cost basis”). Financial accounting builds in this aspect of conservatism.

For example, companies often sell their products at a higher price than their cost. However, accountants have to record their values based on historical cost as opposed to what they can sell for. In other words, the value of inventory is based on how much it cost the company to produce these inventory. It’s not based on the value these inventory can sell for. Another example is real estate. A company could have purchased a piece of land 40 years ago that’s worth ten times as much today. However, despite the higher valuation in today’s market, the company would have to record the value of land at cost. It has to record the value of the land based on how much it originally cost to acquire the land. Cost Principle instills an aspect of conservatism into financial statements.

Matching Principle:

The Matching Principle requires revenues and any related expenses be recognized together (“matched”) in the same reporting period. Certain expenses will reduce the value of Assets. For example, recognized Depreciation Expense will reduce the value of PP&E. Bad Debt Expense will reduce the value of Accounts Receivables. Goodwill Impairment will reduce the value of Goodwill. The value of Assets are reduced by associated expenses when they are recognized under the Matching Principle.

Lower of Cost and Market:

Businesses are required to regularly assess the Fair Market Value (“FMV”) of their assets. FMV is what their assets can be sold for in today’s market. Under US accounting rules, companies have to record the lower of historical cost and Fair Market Value. Nothing is done if the FMV is greater than the value of the asset recorded on the Balance Sheet. However, companies have to mark down the value if the FMV is lower than cost.

Continuing with the previous example where a company had purchased a piece of land 40 years ago. If the land is worth more today than what the company had paid for, nothing changes. The company continues to record the land based on historical cost. But if the land is worth less today than original cost, then it’ll have to reduce the value. The company will have to record it at the Fair Market Value because it’s lower than historical cost. This is another aspect of conservatism built into accounting to prevent artificially inflating any company’s value.

Balance Sheet for Investing

By this point of this article, you should now understand what a Balance Sheet is. You should also know what it looks like, its structure, the common line items, and the underlying accounting principles. Naturally, the million-dollar question becomes: so what? What does the Balance Sheet tell you about a company? How can you derive insights from the Balance Sheet for investing?

What Balance Sheet Tells You Image

In short, the Balance Sheet tells you (1) the company’s capital structure, (2) its floor valuation, (3) whether it has any significant assets other than the core business operations, (4) whether the core business is earning a good return and (5) whether it has enough liquidity.

  1. Capital Structure

    The Balance Sheet tells us what the company’s capital structure looks like. It’s where we find out how much cash, investments and debt the company has. These are important numbers that we need to bridge between Equity Value and Enterprise Value. If you don’t know how capital structure affects a company’s valuation, you should check out our curriculum on Corporate Valuation. Calculating Equity Value and Enterprise Value is an important step in investment analysis.

  2. Balance Sheet as Valuation Reference

    An easy check on valuation is to compare the value of Shareholder’s Equity with Equity Value (aka “Market Capitalization”). For most companies outside of the financial services industry, Shareholder’s Equity is much lower than Equity Value. Therefore, Shareholder’s Equity establishes the floor valuation for the company. If Shareholder’s Equity is somehow higher than Equity Value, it could indicate that there’s something going on with the company. For companies in the financial services industry, such as banks and insurers, Shareholder’s Equity serves as an important valuation metric.

  3. Sources of Non-Core Value

    The Balance Sheet tells us whether the company owns any significant investments. Investments are important sources of value separate from the core business, which is measured by Enterprise Value.

    This non-core value is often captured in “Long-Term Investments” or “Investments in Equity Interests”. A real-life example is Yahoo. About a decade ago, Yahoo owned not only its core business (yahoo.com) but also 44% of Alibaba. Yahoo captures its stake in Alibaba in the Investments line on its Balance Sheet under Long-Term Assets. 44% of Alibaba is worth +$200 billion today, but Yahoo’s Balance Sheet only recorded it at $2 billion. At the time, the stock market had priced Yahoo’s stock based only on its core business operations: yahoo.com. This means investors that bought Yahoo stock not only received a stake in yahoo.com but also a piece of Alibaba. They were able to get yahoo.com and a piece of the 44% Alibaba stake for the price of just yahoo.com! Yahoo disclosed information regarding the details of the Alibaba stake in footnotes to the Balance Sheet.

  4. Return on Invested Capital (ROIC)

    The Balance Sheet tells us whether the company’s core business operations is earning a good enough return on its investments. Said differently, it tells us whether the company is earning enough money given how much it had to spend. The return a company earns from its business usually go hand-in-hand with the returns investors earn on their investment. In particular, investors want to look for businesses that are earning a ROIC above WACC.

  5. Liquidity and Efficiency

    We can calculate Balance Sheet ratios to analyze the company’s liquidity and efficiency. Current Ratio, Quick Ratio and Net Debt (Cash) show whether the company has enough cash to cover its needs. We can also calculate various ratios such as Inventory Turnover, Days Receivable, Days Payable, etc. These ratios partially reflect how efficiently a company is running the various aspects of its business. Frankly, this usually isn’t a significant component of investment thesis. However, it could potentially play a role in an activist investing thesis. Activist investors can push management to improve upon inefficiencies, which will enhance the company’s ability to generate cash flow.

If you know where to look, you can find out a lot about the company from analyzing its Balance Sheet. We’ll go over this in more depth in our courses.

Basic EPS

By Accounting No Comments

What is Basic EPS?

Basic EPS, or Basic Earnings Per Share, is one of the financial metrics that measure a company’s profitability. Specifically, Basic EPS measures the amount of Net Income a company earns for each of its common stock outstanding.

To calculate Basic EPS, we divide Net Income by the Basic Weighted Average Shares Outstanding (Basic WASO). For example, suppose a company has $1 million Net Income and 1 million Basic WASO. In this case, its Basic EPS is $1.00.

A lot of articles online would tell you that Basic EPS is really important. The logic is that it helps investors and analysts evaluate a company’s per share profitability and value. Afterall, it’s difficult and potentially discrediting to argue it’s anything but that. But the truth is that Basic EPS is not important. While EPS is important, Basic EPS is not. Essentially, EPS has two variations: Basic EPS and Diluted EPS. Basic EPS is the rarely-if-ever-used version of EPS. Diluted EPS, on the other hand, is the nearly-always-used version of EPS. We go over this concept in detail in our curriculum: Course 6, Lessons 11-12.

In fact, Basic EPS is a number that barely gets used among finance professionals. We don’t recall ever basing our analyses on this number during our investment banking work at Goldman Sachs.

The reason Basic EPS is almost never used is because it does not take into account potential dilution. Dilution occurs when a company issues additional shares of common stock. Dilution can decrease the Earnings per Share. Therefore, analysts prefer to use Diluted EPS, which factors in the potential impact of dilution on earnings per share.

Basic EPS is typically reported by companies in on the Income Statement.

Basic EPS Formula

Here’s the formula to calculate Basic EPS.

Basic EPS Formula

The formula is actually very simple. We simply take the company’s Net Income and divide it by the Basic Weighted Average Shares Outstanding.

Basic EPS Example

Let’s take a look at Apple. For the 2022 fiscal year (page 29), Apple reported $99.8 billion in Net Income and 16.22 billion Basic WASO. To calculate Basic EPS, we can divide the two numbers.

Basic EPS = Net Income / Basic WASO = $99.8 billion / 16.22 billion Basic WASO.

Basic EPS = $6.15 per share.

So, Apple’s Basic EPS for the 2022 fiscal year was $6.15 per share. This means the company earned $6.15 of profit for each of its shares in 2022.

Most companies’ Basic EPS is as simple as this. However, for a minority set of companies, there can be curveballs. In the next section, we’ll go over different curveballs that might arise when calculating Basic EPS.

Impact of Preferred Stocks

The first curveball that can come up when calculating Basic EPS is when the company in question has Preferred Stocks. The vast majority of companies don’t have Preferred Stocks. They only have Common Stocks. However, a small subset of companies has Preferred Stocks. These Preferred Stocks often have fixed dividends.

Recall that Basic EPS measures the amount of Net Income a company earns for each of its common stock outstanding. Conceptually, it measures the common stocks’ entitlement to profit. Therefore, we have to subtract out the portion of Net Income that the company will pay to preferred shareholders.

Thus, for companies with Preferred Stocks, the formula for Basic EPS becomes as follows.

Formula: Basic EPS = (Net Income – Preferred Dividends) / Basic WASO

Impact of Non-Controlling Interest

The second curveball that can come up when calculating Basic EPS is when the company in question has Non-Controlling Interest (see Course 10, Lesson 28). The vast majority of companies don’t have Non-Controlling Interest (NCI), so this doesn’t come up very often. Luckily, handling NCI in Basic EPS is actually pretty simple.

Starting with Net Income including NCI, we subtract Net Income Attributable to NCI. This gives us the Net Income excluding Non-Controlling Interest, which is what’s attributable to the company’s common shareholders. Then, we divide this Net Income Attributable to Common Stocks by Basic WASO to get Basic EPS.

Formula: Basic EPS = (Net Income – Net Income Attributable to NCI) / Basic WASO

Uber, for example, is a company that has Non-Controlling Interest. Here’s Uber’s Income Statement for 2022 fiscal year (page 74). The Net Income number you should use for Basic EPS is the “Net Income (Loss) Attributable to Uber Technologies, Inc.” That’s the profit metric after deducting the profit attributable to Non-Controlling Interest.

Basic EPS Uber Example

Impact of Non-Recurring Items

The Basic EPS that companies report on the Income Statement are usually GAAP numbers. They usually include one-time, non-recurring items. Ideally, you should adjust the reported Basic EPS to neutralize the impact of these non-recurring items. This way, you get a normalized Basic EPS that more accurately reflects the company’s ongoing earnings potential. Adjusting earnings is a pretty big topic on its own so we won’t dig too deep into it here.

Basic vs. Diluted EPS

The difference between Basic EPS and Diluted EPS lies in the number of outstanding shares used to calculate EPS.

Basic EPS divides the company’s Net Income by basic outstanding shares of common stock. This means that the company only takes into account the shares that are currently in existence.

Diluted EPS divides the company’s Net Income by diluted outstanding shares of common stock. This means that the company not only includes the shares that are currently in existence but also shares that will eventually come into existence in the future. In other words, Dilute EPS takes into account the potential impact of dilution on EPS. Dilution occurs when a company issues additional shares of common stock or securities that can be converted into common stock, such as stock options, warrants or units. These additional shares or securities will reduce the shareholders’ true EPS. As a result, most professional analysts use Diluted EPS to measure the company’s profitability on a per share basis. Our curriculum goes over the concept of dilution in detail in Course 3.

To calculate Diluted EPS, the potential dilutive effect of these additional shares or securities is factored in. This is done using the “Treasury Stock Method” or the “If-Converted Method”. The two methods assume that the additional shares or securities are actually exercised or converted into common stock, and the proceeds are used to buy back outstanding shares of common stock.

By factoring in the potential dilutive effect of additional shares or securities, Diluted EPS provides a more conservative estimate of earnings per share than Basic EPS. Diluted EPS is typically lower than Basic EPS.

In summary, Basic EPS assumes that there are no potential dilutive securities outstanding. It only takes into account shares that currently exist. By contrast, Diluted EPS factors in the impact of dilutive securities that can create additional shares in the future. Consequently, Diluted EPS provides a more conservative and truer estimate of earnings per share.

Do You Use Basic or Diluted WASO for EPS?

Companies calculate Basic EPS using Basic WASO. Net Income divided by Basic WASO equals Basic EPS.

Companies calculate Diluted EPS using Diluted WASO. Net Income divided by Diluted WASO equals Diluted EPS.

Should You Use Basic or Diluted EPS?

For valuation analysis, you nearly always use Diluted EPS. You almost never use Basic EPS. We’re using “almost never” instead of a simple “never” to not be absolute. After all, never say never. For example, let’s say you’re trying to calculate a company’s P/E multiple. In this case, you’d use the stock’s current stock price for the numerator and Diluted EPS for the denominator.

How to Increase Basic EPS

From an investor’s perspective, the higher the EPS the better. That’s because a higher EPS means the company is earning more profit for each share. If we own a company’s stocks, we naturally want the company to earn as much profit per share as possible.

So how can companies increase Basic EPS? Well, based on the formula, there’re really two levers that companies can pull. They must either increase Net Income or decrease Basic WASO. To increase Net Income, they must either increase Revenue or decrease Cost. To decrease Basic WASO, they must do share buybacks. That’s how companies can increase Basic EPS.

Learn More

At Lumovest, we’re building the place where anyone can learn finance and investing in an affordable and easy-to-understand manner. Our courses are far more intuitive, visualized, logical and colloquial than your college professor-taught courses. Our courses are taught by Goldman Sachs investment banker who has worked on transactions worth over $50 billion. We designed our courses to prepare you to succeed in the world of high finance. You’ll learn how to conduct financial analysis exactly like how it’s done on Wall Street’s top firms. Upon completion of the courses, you will receive our Global Financial & Investment Analyst (GFIA) certification. You can sign up here.

Beta

By Valuation No Comments

What is Beta?

Beta (β) measures how much an individual security’s price fluctuates in relation to the broader market. Analysts use the Beta Coefficient to determine the volatility and risk of a stock or another security relative to the overall market.

Stocks whose prices move generally in the same direction as the stock market will have positive β. Stocks whose prices move in the opposite direction as the stock market will have negative β. Gold and gold stocks, for example, have a negative Beta Coefficient. Investors view gold as a “safe haven” that stores value. When the stock market declines, investors take money out of stocks and invest in gold. As a result, when stock prices decline, gold prices often increase due to the increased demand.

The stock market has a standard Beta of 1.0. Individual stocks will have Betas higher or lower than 1.0, based on their volatility relative to the stock market as a whole. Stock whose prices move to a greater extent than the stock market have β higher than 1.0. These stocks are more volatile than the overall market. Stocks whose prices move to a lesser extent than the stock market have β lower than 1.0. These stocks are less volatile than the overall market.

In short, Beta can be either positive or negative. It can also be higher or lower than 1.0.

Measure of Risk

Financial analysts use Beta as a measure of a stock’s risk. Volatility indicates risk. The higher the β, the higher the risk. Likewise, the lower the coefficient, the lower the risk. In other words, Beta is a measure of the stock’s risk profile relative to the broader stock market. A β higher than 1.0 is more risky than the stock market. A β lower than 1.0 is less risky than the stock market.

This concept of the coefficient is an important component of the Capital Asset Pricing Model (CAPM). CAPM uses this metric to calculate Cost of Equity, which flows into the Discounted Cash Flow analysis.

Blackout Period

By M&A No Comments

What is Blackout Period?

A blackout period is an important concept in finance. It refers to a period of time when certain trading and investor communication activities of public companies are restricted. Blackout periods apply to public companies, their employees and their investors. They ensure fairness and transparency in the market. We will explore this concept in detail.

Types of Blackout Period

Let’s examine different types of blackout periods. There are three main types: trading, insider, and earnings.

Trading blackout periods are for employees. They restrict trading of company stock. These periods occur around significant events. Examples include mergers, acquisitions, or earnings announcements. The goal is to prevent insider trading. It ensures all investors have equal information.

Insider blackout periods affect company insiders. Insiders are top executives or large shareholders. They have access to non-public information. This period restricts their stock trading. It prevents them from using this information unfairly. The Securities and Exchange Commission (SEC) regulates insider trading.

Earnings blackout periods focus on financial reports. Companies must release quarterly earnings. This period restricts information release. It starts before the earnings report. It ends after the report is public. This period ensures accurate financial reporting.

Why Blackout Periods Even Exist

Now, let’s understand the importance of blackout periods. They serve several purposes.

Promote fair play: Blackout periods level the playing field. They prevent insiders from taking advantage. All investors have equal access to information.

Minimize legal issues: Trading on non-public information is illegal. Blackout periods reduce the risk of insider trading. This helps avoid legal trouble for companies and employees.

Maintain investor confidence: Fair trading practices boost investor trust. Blackout periods help maintain market integrity. This encourages investors to participate in the market.

Enhance transparency: Companies need to be transparent about their finances. Blackout periods help ensure accurate reporting. This makes it easier for investors to make informed decisions.

Protect company reputation: Insider trading scandals harm company reputation. By imposing blackout periods, companies protect their brand image.

Blackout Period Duration

Now that we know the importance, let’s discuss the duration of blackout periods. The length varies based on the type of blackout period.

Trading blackout periods: These usually last a few days or weeks. They surround significant corporate events.

Insider blackout periods: These can last a few weeks or months. They may be longer around significant events, like mergers.

Earnings blackout periods: These typically last a few weeks. They begin before the earnings release and end after the announcement.

Non-Compliance Consequences

Now, let’s explore the consequences of violating blackout periods. There are several penalties for non-compliance.

Legal consequences: Insider trading is illegal. Violators may face fines, penalties, or imprisonment.

Loss of reputation: Insider trading scandals damage company reputation. This can affect stock prices and investor trust.

Employment consequences: Employees caught violating blackout periods may face job loss or demotion.

Regulatory sanctions: Companies may face regulatory penalties for non-compliance. This can include fines or restrictions on future activities.

How Companies Enforce Blackout Period

Now that we understand the consequences, let’s discuss how companies enforce blackout periods.

Internal policies: Companies create policies around blackout periods. These outline the rules and restrictions for employees and insiders. Here’s an example.

Training and education: Companies educate employees about blackout periods. They provide training on legal and ethical trading practices.

Monitoring and surveillance: Companies monitor trading activities. They use surveillance tools to detect potential violations.

Reporting mechanisms: Companies establish reporting systems. Employees can report potential violations anonymously.

Disciplinary action: Companies enforce strict consequences for violations. This includes termination, demotion, or legal action.

Legal Exceptions to Blackout Period

Let’s now discuss exceptions to blackout periods. There are certain situations where trading is allowed.

Pre-planned trades: Insiders can set up a pre-planned trading schedule. This is known as a 10b5-1 plan. It allows trading during blackout periods, following specific rules.

Hardship exceptions: Companies may grant exceptions in case of financial hardship. Employees must provide proof of the hardship.

Stock option exercises: Exercising stock options may be allowed. However, selling the shares may still be restricted.

Dividend reinvestment plans: Automatic reinvestment of dividends may be permitted. This exception does not apply to new investments or withdrawals.

Conclusion

In conclusion, blackout periods are crucial in finance. They ensure fair play, transparency, and investor confidence. There are different types, such as trading, insider, and earnings blackout periods. Companies must enforce blackout periods to avoid legal issues, protect their reputation, and maintain investor trust. Violating blackout periods can result in severe consequences. Companies enforce these periods through internal policies, training, monitoring, and disciplinary actions. However, there are certain exceptions that allow trading under specific conditions.

Learn More

At Lumovest, we’re building the place where anyone can learn finance and investing in an affordable and easy-to-understand manner. Trust us, our courses are far more intuitive, visualized, logical and colloquial than your college professor-taught courses. Our courses are taught by Goldman Sachs investment banker who has worked on transactions worth over $50 billion. We designed our courses to prepare you to succeed in the world of high finance. You’ll learn how to conduct financial analysis exactly like how it’s done on Wall Street’s top firms. Upon completion of the courses, you will receive our Global Financial & Investment Analyst (GFIA) certification. You can sign up here.

Book Value

By Accounting No Comments

What is Book Value?

Book Value has two definitions based on the term usage.

First, Book Value is the value of anything appearing on the Balance Sheet. Traditionally, companies record their assets, liabilities and equity in a book. Therefore, the value of these items as recorded in their books is known as “Book Value”. When someone says the “Book Value of XYZ”, it means the value of XYZ on the Balance Sheet. So for example, the “Book Value of Intangible Assets” is the value of Intangible Assets on the Balance Sheet. The “Book Value of PP&E” is the value of PP&E on the Balance Sheet. This definition is based on the usage that specifies a particular item.

Second, Book Value is the value of Shareholder’s Equity on the Balance Sheet. It is one of several metrics that measure the value of the company entitled to equity investors. For reasons we’ll elaborate below, Book Value is a poor way to measure the value entitled to equity investors. When people use the term without specifying any particular item, they’re likely talking about the “Book Value of equity”. As an example, suppose someone says “The book value of the company is $300 million.” They are saying that the value of Shareholder’s Equity on the Balance Sheet is $300 million. This definition is based on the usage that does not specify any particular item.

Either way, Book Value refers to a value on the Balance Sheet. It can refer to any item on the Balance Sheet, or it can refer specifically to Shareholder’s Equity.

Because the first definition is pretty self-explanatory, we’ll focus the explanation of Book Value on the second definition. In other words, when we say “Book Value” in this article, we mean the value of “Shareholder’s Equity”.

Book Value Formula

There are two main ways to calculate Book Value (under the Shareholder’s Equity definition).

The first way uses the Accounting Equation. Recall that there are three sections on the Balance Sheet: Assets, Liabilities and Shareholder’s Equity. The Accounting Equation stipulates that Assets minus Liabilities must equal Shareholder’s Equity. Therefore, if we subtract Liabilities from Assets, it will give us the company’s Book Value.

Book Value Formula

The second way adds up all the individual components that make up Shareholder’s Equity (Book Value). Recall that Shareholder’s Equity is a section on the Balance Sheet. Within this section, there are individual line items that eventually add up to the section total. Naturally, another way to calculate the Book Value is to add up these individual line items. For most companies, the line items under the Shareholder’s Equity section are Common Stock Par Value, Additional Paid-In Capital, Retained Earnings, Accumulated Other Comprehensive Income and Treasury Stock. When we say you “add up” these numbers, we mean that you use the addition function. However, some of these numbers can appear in negative form. For example, Treasury Stock appears in negative form. By “adding” Treasury Stock, which is a negative number, you’re essentially subtracting it. Likewise, a negative Retained Earnings is known as Accumulated Deficit. By “adding” Accumulated Deficit, which is a negative number, you’re really subtracting it. Add up all these number and that gives us the company’s Book Value.

Book Value Example

Let’s take a look at an example of Book Value using Apple, Inc. Please take a look at its FY2022 Balance Sheet (Page 31).

Using the first way, we see that Apple reported Total Assets of $352,755 million and Total Liabilities of $302,083 million. The difference between the two equals Book Value of $50,672 million.

Using the second way, we see that Apple reported Common Stock Par Value and APIC of $64,849 million, Accumulated Deficit of negative $3,068 million, and Accumulated Other Comprehensive Loss of $11,109 million. The sum of these numbers equals Book Value of $50,672 million.

Frankly, for public companies, this isn’t a number you’ll need to calculate. Why? Because they report the Book Value explicitly on the Balance Sheet. In Apple’s Shareholder’s Equity section, you can see clearly that the company explicitly states that it has a Shareholder’s Equity of $50,672 million.

Book Value Example Apple

Book vs. Market

Book Value and Market Value are two different metrics used to measure a company’s value. Book Value is the value of a company’s assets minus its liabilities, as reported on its Balance Sheet. Market Value, on the other hand, is the price at which a company’s stock is currently trading in the stock market.

Book Value provides an estimate of what the company would be worth if all its assets were sold and all its debts were paid off. Book Value is calculated using historical cost accounting methods, which means that the value of the company’s assets is based on the original purchase price, adjusted for depreciation.

Market Value, on the other hand, is a reflection of the current market demand for the company’s stock. It is influenced by a variety of factors such as investor sentiment, industry trends, and the company’s future growth potential. Market Value is determined by the supply and demand for the company’s shares in the stock market, and is constantly changing as investors buy and sell shares.

One major difference between Book Value and Market Value is that market value takes into account future growth potential, while Book Value does not. Market Value reflects the market’s expectations for a company’s future earnings, growth prospects, and other factors that can affect its stock price. Book Value, on the other hand, is based solely on the company’s historical financial statements and does not consider future growth potential.

In general, Market Value is considered a more important metric for investors than Book Value. That’s because the former reflects market demand for the stock and growth potential. However, Book Value can be useful in identifying undervalued companies, and is often used in conjunction with other metrics and analysis to evaluate a company’s overall value and investment potential.

Book vs. Intrinsic

Book Value and Intrinsic Value are also two completely different concepts.

Book Value is the value of a company’s assets minus its liabilities, as reported on its Balance Sheet. It measures the amount of money leftover to equity holders based on historical accounting records.

Intrinsic Value, on the other hand, is an estimate of the true or fair value of the equity, based on the company’s future earnings potential independent of what price (Market Value) the company’s stock is trading at in the stock market. Intrinsic Value takes into account qualitative factors such as the company’s management team, brand strength, and competitive position, as well as quantitative factors such as earnings, cash flow, and financial ratios.

Intrinsic Value is a subjective estimate that can vary depending on the analyst’s assumptions and methodology. It is often calculated using Discounted Cash Flow (DCF) analysis, which estimates the present value of the company’s future cash flows.

While Book Value is based on historical accounting principles, Intrinsic Value is forward-looking and based on future expectations. Intrinsic Value can be higher or lower than Book Value, depending on the company’s growth prospects and other factors.

In general, Intrinsic Value is considered a more important metric for investors than Book Value. That’s because it provides a more complete picture of a company’s potential value and investment potential. However, Book Value can be useful in identifying undervalued companies and as a starting point for further analysis.

Why is It Called “Book Value”?

Back in the day, companies maintained their accounting records by paper and pen. As you can imagine, that results in a heavy stack of papers that appear like books. Therefore, people often refer the practice of keeping accounting records as “keeping books”.

Because Book Value is the amount recorded in these accounting records (“books”), people coined the term “Book Value”.

Can Book Value Be Negative?

Yes, Book Value can be negative. In fact, a lot of companies have negative Book Value. It’s not necessarily a bad thing. Conceptually, Book Value can be negative for two types of companies. Whether negative Book Value is good or bad depends on which type the company is.

The first type of company that has negative Book Value is money-losing companies. These companies have lost so much money that Retained Earnings (Accumulated Deficit) is heavily negative. This causes the overall Shareholder’s Equity to turn negative.

The second type of company that has negative Book Value is companies that returned a lot of capital to shareholders. These companies have used way more cash for dividends and share repurchases that Shareholder’s Equity turns negative.

In short, Book Value can absolutely be negative. And it’s not necessarily a bad thing.

Learn More

At Lumovest, we’re building the place where anyone can learn finance and investing in an affordable and easy-to-understand manner. Our courses are far more intuitive, visualized, logical and colloquial than your college professor-taught courses. Our courses are taught by Goldman Sachs investment banker who has worked on transactions worth over $50 billion. We designed our courses to prepare you to succeed in the world of high finance. You’ll learn how to conduct financial analysis exactly like how it’s done on Wall Street’s top firms. Upon completion of the courses, you will receive our Global Financial & Investment Analyst (GFIA) certification. You can sign up here.

Capital Expenditures (CapEx)

By Accounting No Comments

What are Capital Expenditures (CapEx)

Capital Expenditures (CapEx) is the cash a company pays for capital assets that will deliver long-term value to the business. These capital assets usually consist of (1) PP&E and (2) Intangible Assets. PP&E are physical assets, such as buildings, office fixture, cash registers, machinery, etc. Intangible Assets are things like patents and software. Companies makes these spending with the intention of improving or expanding the business, increasing efficiency, or maintaining competitive advantage.

If a company spends $500 buying desks and chairs for its employees, it’d record the $500 as CapEx. Likewise, if a gas station spends $10,000 buying a new gas machine, it’d record the $10,000 as CapEx.

In most instances, companies spend Capital Expenditures mostly on physical assets, such as buildings, machineries, and equipment. A common misconception is that Capital Expenditures only include spending on physical assets. This is not true. Capital Expenditures are expenditures related to capital assets, which are assets that drive the company’s long-term growth. These capital assets may include both PP&E and Intangible Assets. Both PP&E and Intangible Assets enable the business to operate and generate value over the long-term. Therefore, Capital Expenditures include cash spent on both PP&E and Intangible Assets.

However, in practice, many companies spend most of their Capital Expenditures on PP&E. That’s because physical assets often require ongoing maintenance. As a result, in practice, CapEx mostly relate to spending on physical assets.

Capital Expenditures can be categorized into two main types: Growth Capex and Maintenance Capex. Growth CapEx are spendings to expand the business, such as opening new locations, launching new products, or upgrading technology. On the other hand, Maintenance CapEx are investments to maintain the existing business, such as repairing machinery or replacing equipment.

How CapEx Appears on Financial Statements

Capital Expenditures is a line item on the Cash Flow Statement. It usually appears as a cash outflow under Cash Flow from Investing. When companies spend cash to buy capital assets, they are making an investment. They are investing into their core business operations. Therefore, it’s categorized as an investing activity.

Companies that spent all of their CapEx on physical assets will call it “Purchases of Property, Plant and Equipment” or “Purchases of Physical Assets” instead of “Capital Expenditures”. Regardless, the terms are conceptually similar.

Here’s an example from Amazon (10-K page 36).

Capital Expenditures Example Amazon

Remember, CapEx is the cash the company spends on long-term assets. The long-term assets acquired through CapEx recorded on the Balance Sheet, usually in the line item “Property, Plant & Equipment”. These assets depreciate over their useful lives. Useful life is the estimated period of time that the asset will generate benefits for the company. The Depreciation expense is then recorded on the Income Statement and Cash Flow Statement as a non-cash expense.

Capital Expenditures are a key component of a company’s financial management as they can impact the company’s cash flow. Properly managing CapEx is important to ensure the company is investing in the right projects to drive growth and profitability.

Capital Expenditure Examples

Here are some CapEx examples.

Property: A company may invest in real estate to expand its facilities, build new locations, or purchase land.

Equipment: A company may invest in machinery or other equipment to improve production efficiency, increase capacity, or upgrade existing equipment. Examples of equipment include machinery, computers, phones, cash registers, shelves, etc.

Office Furniture & Fixture: A company may invest in things for the office, such as desks, chairs, sofa, conference call technologies, etc.

Technology: A company may invest in software, hardware, or other technology.

The above are some broad examples of CapEx. However, it’s equally important to understand what’s not considered CapEx. Purchase of other businesses is not a form of Capital Expenditure. That’s part of M&A. It’s recorded separately in a different line item on the financial statements.

Growth CapEx

Growth CapEx refers to capital expenditures made by a company to expand or grow its business. These investments are typically focused on increasing revenue, improving market share, or entering new markets. Here’s a real example of Growth CapEx made by Apple.

One of Apple’s recent Growth CapEx initiatives is the development of its own processors for use in its Mac computers. In 2020, Apple announced that it would transition from using Intel processors to its own Apple Silicon processors. The company claimed this would provide better performance and energy efficiency. This initiative required significant investment in R&D equipment, as well as changes to Apple’s supply chain and manufacturing processes.

Apple has also invested heavily in building new retail stores, which have become a significant source of revenue. The spending required to buy the furniture and fixtures required to fill the retail stores is part of Growth CapEx. In recent years, Apple has opened new retail locations in China, India, and other emerging markets. These investments in retail stores have helped Apple to grow its customer base and increase sales of its products.

Maintenance CapEx

Maintenance CapEx refers to capital expenditures made by a company to maintain, repair or replace existing assets. Companies make these spendings to ensure their businesses continue to operate and prevent downtime or failure. These investments are typically focused on maintaining the existing level of operations and are necessary for a company’s long-term success. Here’s a real example of Maintenance CapEx made by United Airlines.

United Airlines is a well-known example of a company that invested heavily in Maintenance CapEx. In 2020, United Airlines announced that it would invest $1 billion in its facilities over the next few years to upgrade and modernize its aircraft fleet.

One of the key initiatives that United Airlines is undertaking as part of this investment is the construction of a new widebody aircraft maintenance facility at its hub in San Francisco. The new facility will be capable of performing maintenance on up to six widebody aircraft at a time. Additionally, it will include state-of-the-art equipment and technology to improve efficiency and reduce downtime.

United Airlines is also investing in the maintenance of its existing aircraft fleet, which is critical to the airline’s operations. In 2020, United Airlines invested $300 million in engine maintenance and overhauls.

Overall, Maintenance CapEx is an essential component of a company’s strategy to maintain its assets and ensure their continued operation. Companies that invest wisely in Maintenance CapEx initiatives can minimize downtime and prevent unexpected failures. Without Maintenance CapEx, equipment’s natural wear and tear can have significant impact on a company’s operations and profitability.

Capital Expenditures vs. Operating Expenses

Capital Expenditures (CapEx) and Operating Expenses (OpEx) are two types of spendings that a company incurs in its day-to-day operations. The main difference between the two is in the nature and timing of the expenses.

Capital Expenditures are investments in long-term assets that are expected to deliver multi-year benefits into the future. Examples include purchasing property or equipment, developing new technologies, or expanding a production facility. Because CapEx delivers multi-year benefits, companies amortize it over the useful life of the asset.

On the other hand, Operating Expenses are the costs incurred by a company to maintain its daily operations. These spending typically provide benefit that last less than a year. For example, common OpEx include rent, salaries, marketing, utilities, and other day-to-day expenses.

Another key difference between CapEx and OpEx is how companies treat them for accounting and tax purposes. CapEx is a capital asset that appears on a company’s Cash Flow Statement and Balance Sheet. OpEx is a cost that appears on a company’s Income Statement. CapEx creates Depreciation or Amortization over its useful life. By contrast, OpEx is fully deductible in the reporting period for tax purposes.

Is Capital Expenditures Tax Deductible?

Yes, CapEx is tax-deductible. While CapEx is typically not fully deductible in the year companies make the spending, it is generally tax-deductible over the useful life of the asset.

For tax purposes, CapEx is typically treated as a capital asset. This means it’s subject to Depreciation or Amortization over its useful life, as determined by the tax code. The IRS established rules for how to calculate the useful life of various types of assets. Companies must use these rules to determine the amount of Depreciation or Amortization to deduct each year.

Therefore, the tax deductions in the form of Depreciation & Amortization for CapEx are spread out over several years. This can help to reduce the company’s taxable income in each of those years. Companies that made significant CapEx can offset Depreciation & Amortization against their taxable income.

However, tax treatment of CapEx can vary depending on the specific circumstances of the investment and each country’s tax code.

CapEx Formulas

Because CapEx is a number that companies report directly on the Cash Flow Statement, you don’t really need to calculate it. However, there are a few formulas related to CapEx you should know.

Capital Expenditures Formula

The first formula captures Capital Expenditures’ relationship with PP&E.

Previous Period PP&E + Current Period Capital Expenditures – Current Period Depreciation = Current Period PP&E.

This formula is used to calculate the total amount of capital expenditures made by a company during a specific period. It takes into account the ending and beginning balances of the company’s net property, plant, and equipment (PPE), as well as the depreciation expense incurred during the period.

The second formula captures Capital Expenditures’ relationship with Revenue.

Capital Expenditures / Revenue = CapEx as a % of Revenue

This formula calculates the percentage of sales that a company is investing in Capital Expenditures. It divides the company’s CapEx by its Revenue and measures the company’s capital intensity.

The third formula captures Capital Expenditures’ relationship with the expected benefits.

Capital Expenditures / Annual Incremental Cash Inflows = Payback Period

This formula calculates the time it takes for a company to recover CapEx through incremental cash flows from the CapEx. The shorter the payback period, the more economically attractive the investment.

How Do You Calculate CapEx?

Notice that none of the above formulas calculate CapEx per se. They all measure CapEx in relation to another metric, but none actually calculates CapEx itself.

That’s because CapEx is usually not a number companies calculate through a formula. It’s really based on however much they spend. For example, if they spent $50 buying an office desk, then CapEx is $50. If they spend $1,000 buying an office computer, then the CapEx is $1,000. A company’s total CapEx is the sum of all these investments in long-term assets.

Want to Learn More?

At Lumovest, we’re building the place where anyone can learn finance and investing in an affordable and easy-to-understand manner. Our courses are far more intuitive, visualized, logical and colloquial than your college professor-taught courses. Our courses are taught by Goldman Sachs investment banker who has worked on transactions worth over $50 billion. We designed our courses to prepare you to succeed in the world of high finance. You’ll learn how to conduct financial analysis exactly like how it’s done on Wall Street’s top firms. Upon completion of the courses, you will receive our Global Financial & Investment Analyst (GFIA) certification. You can sign up here.

Capital Lease

By Accounting No Comments

What is Capital Lease?

A Capital Lease is a lease arrangement where the lessee has ownership characteristics. Another name for this is Finance Lease. US GAAP calls it Capital Lease and IFRS calls it Finance Lease.

A lessee, or a tenant, is the party that rents an asset from another party. By contrast, a lessor is the owner of the asset that rents it to another party. Lessor is essentially the landlord.

In a lease arrangement, the lessee rents the asset from the lessor. For example, a company can rent an office from the building landlord. If you rent an apartment, then you have a lease arrangement with the apartment landlord. This is very common. Almost every large company has a lease of some kind.

In the corporate world, large businesses rent assets (i.e. office, vehicles) for many years and for large amounts of money. Sometimes, the company leasing the asset will lease it for most of the asset’s lifespan. As a result, their lease arrangements can often contain “ownership characteristics”. The company might be technically “leasing” the asset, but their arrangement with the lessor may contain characteristics that essentially makes the lessee the owner. These lease arrangements that contain ownership characteristics are known as Capital Leases. By contrast, lease arrangements that don’t have ownership characteristics are just regular leases, or Operating Leases.

Capital Lease Accounting

With a normal Operating Lease, companies don’t record the leased assets on the Balance Sheet because they don’t own it. They’ll just record a rent expense on the Income Statement and track cash payments on the Cash Flow Statement.

With a Capital Lease, companies have to record the leased assets on the Balance Sheet, as if they own it. They will include the value of the leased assets in the Assets section. On the Liabilities section, they’ll record Capital Lease of an equal value. As a result, the Balance Sheet will balance. And then on the Income Statement, they’ll record Depreciation Expense. On the Cash Flow Statement, they’ll add back D&A and track cash payments for the rent.

It’s important to emphasize that under a Capital Lease, companies are still renting the assets. They don’t legally own the assets. The distinction of Capital vs. Operating lease is merely one of whether the arrangement has ownership characteristics. The implication of Capital versus Operating Lease is just how companies present their numbers on the financial statements.

Capital Lease Criteria

Under the US GAAP, a company must capitalize the lease if the arrangement meets any of the following criteria.

  1. Lease Term Test

    The term of the lease is greater than 75% of the asset’s estimated economic life.

  2. Purchase Option Test

    The lease includes an option to purchase the asset for less than fair market value.

  3. Ownership Test

    The lessor transfers ownership of the asset to the lessee at the end of the lease term.

  4. Present Value Test

    The present value of the lease payments exceed 90% of the asset’s fair market value.

The above is the tests that US companies have to hold themselves to under US accounting standards. Internationally, European companies following IFRS face similar tests. Under IFRS, a company should capitalize the lease if the arrangement meets any of the following criteria.

  1. Lease Term Test

    The lease term is for the major part of the economic life of the asset, even if title is not transferred.

  2. Purchase Option Test

    The lessee has the option to purchase the asset at a price sufficiently lower than fair value at the date the option becomes exercisable that, at the inception of the lease, it is reasonably certain that the option will be exercised.

  3. Ownership Test

    The lease transfers ownership of the asset to the lessee by the end of the lease term.

  4. Present Value Test

    At the inception of the lease, the present value of the minimum lease payments amounts to at least substantially all of the fair value of the leased asset.

  5. Specialization Test

    The leased assets are of a specialized nature such that only the lessee can use them without major modifications being made.

Cash and Cash Equivalent

By Accounting No Comments

What is Cash & Cash Equivalent?

Cash and Cash Equivalent is the value of cash and assets that can be easily converted into cash. There are two components: (1) Cash and (2) Cash Equivalent. Let’s go over what each of these entail.

Cash includes physical coins and paper bills, money in checking and savings accounts, money orders, etc. By comparison, Cash Equivalents are assets that can liquidate into cash within 90 days. They are assets such as Certificate of Deposit, Treasury Bills, Commercial Paper, Money Market Funds, etc. Hence, these items are highly liquid and can easily convert into cash within 90 days.

Companies usually group the two together and show them as a single line item. Together, Cash and Cash Equivalent measures the amount of money a company has at its disposal. Financial analysts uses this number often to determine the company’s valuation and to evaluate a company’s spending power.

This is an Asset on the Balance Sheet. Recall that the Balance Sheet orders the Assets section by liquidity. By definition, cash is the most liquid asset any company has. Therefore, it usually appears as the first line on the Balance Sheet, under Current Assets.

Cash Flow from Financing

By Accounting No Comments

What is Cash Flow from Financing?

Cash Flow from Financing is the movement of cash between the company and its investors, both equity investors and credit investors as well as the cost to facilitate these movements.

Cash Flow Statement

By Accounting No Comments

What is a Cash Flow Statement?

Cash flow means movement of cash. Therefore, Cash Flow Statement is a report that shows the company’s movement of cash over a period of time. It tracks the amount of actual cash coming into and going out of the company’s pockets. These cash can be physical cash that we can touch, like dollar bills and coins. It can also be digital cash like deposits in the banks. Both are cash. The Cash Flow Statement tracks where these cash is coming from and where they’re going.

Along with the Income Statement and Balance Sheet, Cash Flow Statement is one of the three main financial statements. In fact, it’s arguably the most important among the three because cash flow is the key driver of valuation. Ultimately, how much a company is worth is based on how much cash it’ll generate. Cash is also what the company uses to pay for its operations and the key determinant of financial health. If we can only have one financial statement to evaluate a company, we would pick the Cash Flow Statement. You must understand cash flow if you want to get one of the high paying finance jobs.

You can think of the Cash Flow Statement as a financial report that tracks all the cash movements. It adds up all the cash inflows and subtracts all the cash outflows. What we have at the end is the overall net change in cash and the ending cash balance.

Cash Flow Statement Purpose

Different people use Cash Flow Statement for different purposes. Senior management uses it to gauge whether there’s enough cash to pay expenses (i.e. suppliers, employees, etc). Investors use it to analyze the company’s free cash flow profile and value the company. Specifically, credit investors focus on whether the company has enough cash to repay debt with interest. Meanwhile, equity investors focus on the ability for the cash to grow over time. Both groups of investors would also want to use the cash flow to estimate the company’s valuation. Competitors might use it to gain insights into the business and compare the performance with their own.

Cash Flow Statement Example

Here’s a real Cash Flow Statement example for Amazon (NASDAQ:AMZN). You can find the Cash Flow Statement on PDF page 44 of Amazon’s annual report.

Cash Flow Statement Example

Cash Flow Statement is also commonly known as the “Statement of Cash Flows”. Large companies would often call it “Statement of Cash Flows” on official documents, especially in company reports.

Cash Flow Statement Format

The Cash Flow Statement has 3 sections: Cash Flow from Operations, Cash Flow from Investing, and Cash Flow from Financing. It’s nearly always presented in this exact order. At the end, it adds up all the cash flows to show the overall Net Change in Cash.

Cash Flow from Operations represents the cash flow generated from and used for running the business operations. It includes cash received from customers, cash paid to suppliers, cash paid for taxes, etc.

Cash Flow from Investing represents the cash flow generated from and used for investments. The cash the company use to reinvest into the business to fund expansions, for example, is captured here. Examples include cash used to build new factories, open new stores, buying other businesses and buying stocks and bonds.

Cash Flow from Financing represents the cash flow generated from and returned to investors. The cash the company raises from investors by issuing stocks and borrowing debt are the two primary cash inflows. Conversely, the cash the company uses to pay dividends, repurchase shares, and repay debt are the three primary cash outflows.

The statement breaks out all the key line items within each section. Cash inflows are presented as positive numbers. Cash outflows are presented as negative numbers in parenthesis format. This way, readers can easily distinguish between cash inflows and cash outflows. If you see a number in parenthesis () on the Cash Flow Statement, it means it’s a cash outflow.

At the end, it sums up all the cash flows in these sections to calculate the Net Change in Cash. This represents how much the company’s cash balance has changed over the period of the Cash Flow Statement. Adding the Net Change in Cash to the beginning cash balance would give us the ending cash balance.

[Beginning Cash + Net Change in Cash = Ending Cash]

Cash Flow from Operations

Let’s go over the common line items under Cash Flow from Operations. There’ll be variations among companies. Some companies will have more lines, while others will have less. However, the lines below are often the main ones.

  1. Net Income

    Under US GAAP, Cash Flow from Operations start with Net Income. Net Income is the first line under Cash Flow from Operations and comes from the Income Statement. It represents the overall profit of the entire company. It adds up all the incomes (Revenue, interest income, other incomes) and subtracts all expenses (operating expenses, interest, taxes). This is the ultimate amount of profit that the company earned for shareholders during the period.

  2. Depreciation & Amortization (D&A)

    Depreciation & Amortization is an expense that reflects the usage of the company’s assets. As the company’s assets are used over time, they experience natural wear and tear. D&A is an expense that captures this natural wear and tear. The Income Statement subtracts D&A expense to calculate Net Income. However, there’s no cash payment required for D&A. No cash is paid for ongoing wear and tear. D&A is merely a reflection of reduction in asset value as assets are used up over time. Therefore, D&A is a non-cash expense. Because it’s deducted in Net Income, we need to add it back here to neutralize the impact of the non-cash expense.

  3. Stock-Based Compensation (SBC)

    Stock-Based Compensation is an expense that reflects the portion of the company’s compensation expense paid with stocks as opposed to cash. SBC is part of the total compensation expense, which is usually part of the SG&A expense. The Income Statement subtracts the entire SG&A expense to calculate Net Income, which means it also subtracts SBC. However, SBC is a non-cash expense. No cash was paid because the company paid with stocks instead. Therefore, it’s a non-cash expense and we need to add it back.

  4. Changes in Accounts Receivables

    When Accounts Receivables decrease, it means the company has collected a portion of the outstanding payments from its customers. Therefore, it’s a cash inflow. When Accounts Receivables increase, it means the company hasn’t collected payment on a portion of the period’s revenue. As a result, the amount of increase in Accounts Receivables must be deducted from Net Income because that’s not cash. That’s why Changes in Accounts Receivables impact Cash Flow from Operations.

  5. Changes in Inventory

    When Inventory decrease, the difference adds to the company’s cash flow. When inventory increase, the change decreases the company’s cash flow.

  6. Changes in Accrued Expenses

    Accrued Expenses are unpaid expenses that the company has accumulated over time. When Accrued Expenses increase, it means there are more unpaid expenses. This means a portion of the expenses deducted in the period’s Net Income hasn’t been paid with cash yet. However, Net Income had subtracted the entire expense regardless of whether it’s paid or not. To give credit to these unpaid expenses that were subtracted, we add increases in Accrued Expenses to cash flow.

    Likewise, when Accrued Expenses decrease, it means the company used cash to pay off the accumulated unpaid expenses. That’s a use of cash. Cash is moving out of the company. Therefore, we subtract the decrease in Accrued Expenses from Net Income to calculate Cash Flow from Operations.

  7. Changes in Prepaid Expenses

    Prepaid Expenses is the value of the cash payment made in advance for expenses, before they are incurred. It’s the amount of cash the company has paid upfront for future expenses. For example, suppose a company pays $10,000 in advance for next year’s insurance. The $10,000 is a Prepaid Expense. Logically, an increase in Prepaid Expenses means the company has spent more cash. It’s a cash outflow, so we need to subtract it from Net Income.

    Likewise, a decrease in Prepaid Expenses means the company had incurred expenses that it had already paid for. These expenses are subtracted in this period’s Net Income. But because these expenses had already been paid for, they don’t require cash payments in the period they are incurred. In other words, there were no cash outflow associated with these expenses incurred during the period. Therefore, we add decreases in Prepaid Expenses to Net Income to give credit to these prepaid expenses.

Cash Flow from Investing

As a reminder, Cash Flow from Investing represents the cash flow generated from and used for investment activities. Generally speaking, there are three types of investments. The first is physical assets, known as Property, Plant & Equipment or PP&E for short. It includes things like factories, office buildings, chairs, tables, refrigerators, computers, etc. The second type is businesses. If a company were to spend cash to acquire another business, the cash being spent is an investment. And the third type is securities, like treasuries, stocks and bonds. Securities are investments the company makes to earn some extra cash on the side.

  1. Capital Expenditures

    Capital Expenditures (CapEx) is the cash spent on Property, Plant & Equipment (PP&E). You can think of CapEx as the cash used to purchase physical assets. If a company were to spend $20,000 buying a new machinery for its factory, that $20,000 is a CapEx. CapEx is a cash outflow. It’s a usage of cash that usually brings Cash Flow from Investing down to the negative territory.

  2. Proceeds from Sale of PP&E

    Proceeds from Sale of PP&E is the cash received from selling the company’s physical assets. It’s exactly what the name sounds like. This line is the polar opposite of Capital Expenditures. Whereas CapEx represents cash spent on buying physical assets, this line represents the cash received from selling existing physical assets. This is a positive number on the statement because it’s a cash inflow.

  3. Acquisitions, Net of Cash Acquired

    This is the amount of cash spent acquiring other businesses, net of the cash that comes with the acquired business. Whereas CapEx is purchases of physical assets (i.e. chairs), Acquisitions refer to the purchase of entire companies (i.e. LLC, corporations). This is cash being spent, so it’s a cash outflow.

  4. Purchases and Sale of Marketable Securities

    Marketable Securities are investment instruments that can be easily bought or sold. Examples are treasuries, stocks and bonds. Purchases of Marketable Securities are cash used to buy these securities. Companies may have a lot of cash in the bank. They want to put these cash to good use and earn some extra money on the side. Purchases are cash outflows, so they show up as negative numbers.

    In contrast, Sale of Marketable Securities refers to the cash received from selling the investment instruments the company owns. It’s the cash proceeds received from selling the company’s investment portfolio of treasuries, stocks and bonds. The cash proceeds received are cash inflows, so they show up as positive numbers.

Cash Flow from Financing

Cash Flow from Financing captures the cash movements between the company and its investors. Inflows are cash the company receive from investors whereas outflows are cash the company returns to investors. Credit and equity investors are the two main types of investors in a company. Therefore, the financing line items mainly relate to cash movements between the company and its debt and equity investors.

  1. Proceeds from Debt Issuance

    Proceeds from Debt Issuance are cash received from borrowing debt. The company is raising money to fund its operations by issuing debt. “Issuing debt” is just a fancy term for borrowing debt. The company is receiving cash from lenders. Therefore, it’s a cash inflow and shown as a positive number on the statement.

  2. Repayment of Debt

    Repayment of Debt is the cash used to repay debt. The company is taking money out of its bank accounts and paying back the debt it had borrowed. However, note that the value in this line only refers to the repayment of debt principal. It does not include Interest Expense, which is included in Net Income under US GAAP. It’s a cash outflow and shown as a negative number on the statement.

  3. Proceeds from Stock Issuance

    Proceeds from Stock Issuance are cash received from issuing additional shares to investors. The company is raising money by giving a piece of the company to investors who provide cash. In other words, it dilutes existing shareholders’ ownership stakes in the company. After the stock issuance, the company has more cash but the existing owners own a smaller proportion of the company. It’s a cash inflow and shown as a positive number on the statement.

  4. Dividend Payments

    Dividend Payments are the cash returned to shareholders from the profits the company has earned. The company is taking cash out of its bank accounts and giving these cash back to its investors. Hence, it’s a cash outflow and shown as a negative number.

  5. Share Repurchase

    Share Repurchase is the amount of cash the company spent to repurchase shares. Buying back shares is a common method of returning capital to equity investors. It’s often more tax-efficient than dividend payments. The company is using cash to buy its stocks back from stockholders. Therefore, it’s giving cash back to investors and a cash outflow.

Foreign Currency Effect

The Cash Flow Statements of large, multi-national companies often have an additional line at the bottom called Foreign Currency Effect. What is this line and why do companies have it?

To understand this line, we need to understand the cash holdings of large multi-national companies. These companies operate in many different countries with different currencies and bank accounts. They’ll have some cash in each country denominated in the local currency. Logically, they need to have cash in local currency in order to fund their local operations. For example, they need to pay employees in Europe with Euros and employees in Japan with Yen. Therefore, multi-national companies spread their cash balance across many different currencies. However, for the purpose of the financial statements, companies have to present their total cash balance in a single currency. They have to account for the cash held in many different currencies in a single currency. Therefore, they have to convert different currencies into a single currency to get the total value of the cash balance.

Unfortunately, the foreign exchange rates among currencies don’t stay the same. They fluctuate daily. When foreign exchange rates fluctuate, it impacts the value of the company’s overall cash balance. Therefore, the value of the company’s cash balance would change every day even without any cash flow activities. To capture the impact on cash balance from foreign exchange rate fluctuations, companies have a line called “Foreign Currency Effect”. It captures the impact on cash balance due to foreign exchange rate fluctuations during the period.

Net Change in Cash

At the bottom of the Cash Flow Statement, it shows the Net Change in Cash. Net Change in Cash is the overall change in value between the company’s cash balance at the beginning of the period and its cash balance at the end. We can calculate Net Change in Cash by adding up all the company’s cash flows and the Foreign Currency Effect on Cash.

Income Statement vs. Cash Flow Statement

Why do we need the Cash Flow Statement when we already have the Income Statement? Doesn’t the Income Statement already tell us how much money the company is making?

Recall that while the Income Statement measures the profitability of the company, it does not measure cash flow. Profits and cash flow are two completely different things. Income Statement measures profits. The Cash Flow Statement measures cash flow.

To illustrate how profits and cash flow differ, let’s review how companies record the values on the Income Statement. Companies record the values on the Income Statement under Accrual Principle and Matching Principle.

Accrual Principle requires companies to recognize revenue when products are provided, without regards to whether cash is received. For example, if a business had delivered goods to a customer before getting paid, it has to record revenue nonetheless. Likewise, if a customer has already paid but the business has yet to provide the product, then the company can’t record the transaction as revenue. Therefore, revenue is the value of goods and services delivered to customers. It’s not cash received.

Similarly, companies recognize expenses under the Accrual Principle and the Matching Principle. Those expenses that have a direct relationship with revenue are recorded when their corresponding revenue is recorded. For example, the cost to produce a product is recognized when the revenue from that product is recognized. Expenses that do not have a direct relationship with revenue are recognized in the period they are used. Pay attention to the criteria here. At no point is the expense recognized based on when cash is paid.

Because of these accounting principles, the values on the Income Statement do not represent cash flow. Cash Flow Statement, on the other hand, measures cash movements purely based on cash received and cash paid.

What Does the Cash Flow Statement Tell You?

To financial analysts, the Cash Flow Statement is arguably the most important among the three financial reports. But why? What does the Cash Flow Statement tell you? Here, we’ll lay out some of the most important insights we can get from this statement.

Free Cash Flow Profile

We need the company’s Cash Flow Statement to calculate its free cash flow metrics. Specifically, we care about Levered Free Cash Flow (LFCF) and Unlevered Free Cash Flow (UFCF). Levered Free Cash Flow and Unlevered Free Cash Flow are two highly important metrics in investing. We won’t be able to calculate them without Cash Flow Statement. The amount of free cash flow the company generates drive its valuation. These free cash flow metrics also enable us to determine the company’s ability to spend on certain items. For example, they enable to estimate how much debt a company can repay or how many shares it can repurchase.

Capital Intensity

The Cash Flow Statement tells us the capital intensity of the business. Said differently, it tells us how much capital the business needs to run its operations or expand its footprint. Specifically, we can look at the Capital Expenditures history. Does the business require a lot of CapEx to keep its business up and running? A capital intensive business would require a lot of CapEx. A non-capital intensive business would have very little CapEx.

Acquisition History

You can get a sense of the company’s acquisition history from the line Acquisitions, Net of Cash Acquired. You can see how much the company spent to buy other businesses and when. There are situations where you’ll need to derive the price the company paid to acquire another business. If the company’s press releases don’t disclose the purchase price, then you can get an estimate from the Cash Flow Statement.

You can also triangulate price paid with valuation multiples to back-solve for the target company’s operating metrics. Once you have the operating metrics, you can potentially back them out of the company’s overall operating metrics. This will allow you evaluate the business’s organic performance independent of acquired financials.

Capital Return Programs

Capital return is an important factor for some investors. We can see whether the company is returning capital to shareholders under Cash Flow from Financing. If the company pays dividends, then it’ll show Dividend Payments. If it has a share buyback program, then it’ll show the amount of cash spent on repurchasing shares. Companies that are not returning capital to investors will not have either of these two lines.

Commitments and Contingencies

By Accounting No Comments

What is Commitments and Contingencies?

Commitments and Contingencies is a type of liability. Commitments are obligations to perform something in the future while Contingencies are possible obligations that can take place based on uncertain future events

Current Assets

By Accounting No Comments

What are Current Assets?

Current Assets are cash and other assets that can be converted into cash within one year. For this reason, it’s also known as Short-Term Assets. We’ll use the two terms interchangeably. This is usually the standard definition for Current Assets because most companies have an operating cycle shorter than a year.

However, for companies whose operating cycle is longer than one year, any Asset expected to be converted into cash within the operating cycle can classified as a Current Asset. An operating cycle is the average period of time it takes for the company to produce the goods, sell them, and receive cash from customers.

Generally speaking, most companies have an operating cycle shorter than a year. Therefore, most companies measure their Short-Term Assets based on the criteria of whether they can be liquidated into cash within one year.

Companies disclose the Current Assets they own and their values on the Balance Sheet. The one year period criteria is measured as 12 months from the date of the Balance Sheet.

Current Assets List

Here’s a list of Current Assets that often appear on companies’ Balance Sheets:

  • Cash & Cash Equivalents: Paper bills, coins, bank deposits, money orders, commercial papers, Certificate of Deposits, etc.
  • Short-Term Investments: US Treasuries, stocks, bonds, crypto-currencies, funds, etc. Companies can easily liquidate these investments, often immediately at the click of a button. It’s also known as Marketable Securities.
  • Accounts Receivables: Expected future payment from customers for products already provided. These are payments that customers owe the company for products that they already received. Customers usually pay within 30-90 days. Therefore, Accounts Receivables is a Short-Term Asset.
  • Inventory: Merchandises the company has not yet sold. Inventory is part of the list because businesses can generally sell most Inventory within one year.
  • Prepaid Expenses: Value of expenses the company has paid upfront and not yet incurred.
  • Deferred Tax Asset: Asset that allows the company to reduce its future taxable income and pay less taxes.

Different companies will have different lists of Short-Term Assets. Some might have more in addition to the above list. Others might have less. It varies from one company to another because it’s dependent on the business model.

Current Assets Example

Here’s a real Balance Sheet showing the Short-Term Assets of Hershey (NYSE: HSY). You can find the Balance Sheet on PDF page 57 of the company’s annual report.

Balance Sheet Example

The Balance Sheet has three main sections: Assets, Liabilities and Equity. Current Assets is a sub-section within Assets.

The Assets section structures line items by order of liquidity. Liquidity is the ease of conversion into cash. The Assets section orders the most liquid line items first and the lease liquid item last. Therefore, the Balance Sheet orders the Current Assets above Non-Current Assets. Within the Current Assets section, nothing is more liquid than Cash & Cash Equivalents. Therefore, Cash & Cash Equivalents is almost always the first line on the Balance Sheet.

Current Assets Formula

To get the most from analyzing Current Assets, you shouldn’t look at them based solely on their absolute values. You should also use Current Assets to calculate various ratios that can yield insights into the operating performance. Here are some formulas that will help you when dealing with Short-Term Assets.

  1. Current Assets = Sum of All Items Listed under Current Assets

    To calculate the total value of Current Assets, we should add up all the items categorized under that section. In the Hershey example, we can just add up Cash & Cash Equivalents, Accounts Receivable, Inventories and Prepaid Expenses. Different companies will have different Short-Term Assets so there isn’t a single formula. Anyone giving you a formula of x+y is ignoring this variability among companies. Therefore, you have to just add up all the items categorized under Current Assets.

  2. Net Working Capital = Current Assets – Current Liabilities

    Net Working Capital (NWC) is the difference between Current Assets and Current Liabilities. You can think of it as the difference between the cash a business will receive and the cash it’ll use in the next 12 months. Whether NWC is positive or negative depends on the business model. Some companies will have positive NWC while others will have consistently negative NWC. Both are normal. What should raise eyebrows, though, is if the business deviates from the historical norm. An example would be a business having negative NWC in one year when it had positive NWC in historical years. So NWC is a metric we need to analyze in relation to a company’s historical performance.

  3. Current Ratio = Current Assets ÷ Current Liabilities

    Current Ratio tells us the percentage of the company’s near-term liabilities that it can repay with liquid assets. The higher the Current Ratio, the safer the company is liquidity-wise. Businesses with high Current Ratio has plenty of cash to cover its operating needs. Companies with Current Ratios <1 could potentially face a liquidity crunch where they don’t have enough cash to fund operations.

  4. Quick Ratio = (Cash & Cash Equivalents + Short-Term Investments + Accounts Receivables) ÷ Current Liabilities

    Quick Ratio is a variation of the Current Ratio, but only based on the most liquid Current Assets. It only includes Cash & Cash Equivalents, Short-Term Investments or Marketable Securities, and Accounts Receivables. Quick Ratio excludes all other Current Assets. This is also a measure of liquidity. A Quick Ratio greater than 1 indicates healthy liquidity.

To learn more about Current Assets, check out our online courses. We’ll go over all the major line items one by one.

Current Liabilities

By Accounting No Comments

What is Current Liabilities?

Current Liabilities are liabilities the company owes that require the usage of cash within one year. Because these obligations require near-term cash payments, they’re also known as Short-Term Liabilities. This is usually the standard definition for Current Liabilities because most companies have an operating cycle shorter than a year.

An operating cycle is the average period of time between producing the goods and receiving cash from customers. For companies whose operating cycle is longer than one year, any Liability expected to be settled with cash payments within the operating cycle can classified as a Current Liability.

In most instances, companies have operating cycles shorter than one year. Therefore, most companies’ Current Liabilities are obligations that require cash settlement within one year.

Companies disclose the Current Liabilities they owe and their values on the Balance Sheet. The one year period criteria is measured as 12 months from the date of the Balance Sheet

Diluted EPS

By Accounting No Comments

What is Diluted EPS?

Diluted EPS, or Diluted Earnings Per Share, is one of the financial metrics that measure a company’s profitability. Specifically, Diluted EPS measures the amount of Net Income a company earns for each of its common stock outstanding and common stock that will get created in the future. We go over the topic of Diluted EPS in greater detail in our curriculum: Course 6, Lesson 11.

To calculate Diluted EPS, we divide Net Income by the Diluted Weighted Average Shares Outstanding (Diluted WASO). For example, suppose a company has $3 million Net Income and 2 million Diluted WASO. In this case, its Diluted EPS is $1.50.

In general, Earnings per Share (EPS) is an extremely important number. It comes in two forms: Basic EPS and Diluted EPS. Basic EPS is almost never used while Diluted EPS is almost always used in financial analysis. This makes Diluted EPS an absolutely essential number in finance.

During our time working in investment banking at Goldman Sachs and in private equity, we used Diluted EPS whenever we had to reference per share earnings. The implication is that as you read about “EPS” online, or in books, or in the news, you should know that chances are they’re referring to Diluted EPS when they say “EPS”. They are not referring to Basic EPS. We go over how to use EPS in financial analysis in our curriculum. Specifically, Course 3 covers calculating Diluted EPS step-by-step; Course 6 covers how to think about EPS; and Course 9 covers using EPS in valuation.

The reason Diluted EPS is the more commonly used form of EPS is because it factors into account potential dilution. Dilution occurs when a company issues additional shares of common stock. Dilution can decrease each share’s earnings. Therefore, analysts prefer to use Diluted EPS, which includes the potential impact of dilution.

Basic EPS is typically reported by companies in on the Income Statement.

Diluted EPS Formula

Here’s the formula to calculate Diluted EPS.

Diluted EPS Formula

The formula is actually very simple. We simply take the company’s Net Income and divide it by the Diluted Weighted Average Shares Outstanding.

Diluted EPS Example

Let’s take a look at Apple. For the 2022 fiscal year (page 29), Apple reported $99.8 billion in Net Income and 16.33 billion Diluted WASO. To calculate Diluted EPS, we can divide the two numbers.

Diluted EPS = Net Income / Diluted WASO = $99.8 billion / 16.33 billion Diluted WASO.

Diluted EPS = $6.11 per share.

So, Apple’s Diluted EPS for the 2022 fiscal year was $6.11 per share. This means the company earned $6.11 of profit in 2022 for every share.

Diluted EPS Example Apple

Most companies’ Diluted EPS is as simple as this. However, for a minority set of companies, there can be curveballs. In the next section, we’ll go over different curveballs that might arise when calculating Diluted EPS.

Impact of Preferred Stocks

The first curveball that can come up when calculating Diluted EPS is when the company in question has Preferred Stocks. The vast majority of companies don’t have Preferred Stocks. They only have Common Stocks. However, a small subset of companies has Preferred Stocks. These Preferred Stocks often have fixed dividends.

Recall that Diluted EPS measures the amount of Net Income a company earns for each of its common stock outstanding and common stock that will get created in the future. Conceptually, it measures the common stocks’ entitlement to profit. The common stockholders are not entitled to the portion of Net Income paid to preferred stockholders through dividends. Therefore, we have to subtract out the portion of Net Income that the company will pay to preferred shareholders.

Consequently, for companies with Preferred Stocks, the formula for Diluted EPS becomes as follows.

Diluted EPS = (Net Income – Preferred Dividends) / Diluted WASO

Impact of Non-Controlling Interest

The second curveball that can come up when calculating Diluted EPS is when the company in question has Non-Controlling Interest (see Course 10, Lesson 28). The vast majority of companies don’t have Non-Controlling Interest (NCI), so this doesn’t come up very often. Luckily, handling NCI in Diluted EPS is actually pretty simple.

Starting with Net Income including NCI, we subtract Net Income Attributable to NCI. This gives us the Net Income excluding Non-Controlling Interest, which is what’s attributable to the company’s common shareholders. Then, we divide this Net Income Attributable to Common Stocks by Diluted WASO to get Diluted EPS.

Diluted EPS = (Net Income – Net Income Attributable to NCI) / Diluted WASO

Verizon, for example, is a company that has Non-Controlling Interest. Here’s Verizon’s 2022 fiscal year Income Statement (page 54). The number you should use for Diluted EPS is the “Net Income Attributable to Verizon”, which was $21.256 billion. That’s the profit metric after deducting the earnings attributable to Non-Controlling Interest. Dividing $21.256 by 4.204 billion Diluted WASO equals $5.06 Diluted EPS.

Diluted EPS Example with Non-Controlling Interest Verizon

Impact of Non-Recurring Items

The Diluted EPS that companies report on the Income Statement are usually GAAP numbers. They usually include one-time, non-recurring items. Ideally, you should adjust the reported Diluted EPS to neutralize the impact of these non-recurring items. This way, you get a normalized Diluted EPS that more accurately reflects the company’s ongoing earnings potential. Adjusting earnings is a pretty big topic on its own so we won’t dig too deep into it here.

Basic vs. Diluted EPS

The difference between Basic EPS and Diluted EPS lies in the number of outstanding shares used to calculate EPS.

Basic EPS divides the company’s Net Income by basic outstanding shares of common stock. This means that the company only takes into account the shares that are currently in existence.

Diluted EPS divides the company’s Net Income by diluted outstanding shares of common stock. This means that the company not only includes the shares that are currently in existence but also shares that will eventually come into existence in the future. In other words, Dilute EPS takes into account the potential impact of dilution on EPS. Dilution occurs when a company issues additional shares of common stock or securities that can be converted into common stock, such as stock options, warrants or units. These additional shares or securities will reduce the shareholders’ true EPS. As a result, most professional analysts use Diluted EPS to measure the company’s profitability on a per share basis. Our curriculum goes over the concept of dilution and how to calculate it in detail in Course 3.

To calculate Diluted EPS, the potential dilutive effect of these additional shares or securities is factored in. This is done using the “Treasury Stock Method” or the “If-Converted Method”. The two methods assume that the additional shares or securities are actually exercised or converted into common stock, and the proceeds are used to buy back outstanding shares of common stock.

By factoring in the potential dilutive effect of additional shares or securities, Diluted EPS provides a more conservative estimate of earnings per share than Basic EPS. Diluted EPS is typically lower than Basic EPS.

In summary, Basic EPS assumes that there are no potential dilutive securities outstanding. It only takes into account shares that currently exist. By contrast, Diluted EPS factors in the impact of dilutive securities that can create additional shares in the future. Consequently, Diluted EPS provides a more conservative and truer estimate of earnings per share.

Do You Use Basic or Diluted WASO for EPS?

Companies calculate Basic EPS using Basic WASO. Net Income divided by Basic WASO equals Basic EPS.

Companies calculate Diluted EPS using Diluted WASO. Net Income divided by Diluted WASO equals Diluted EPS.

Should You Use Basic or Diluted EPS?

For valuation analysis, you nearly always use Diluted EPS. You almost never use Basic EPS. We’re using “almost never” instead of a simple “never” to not be absolute. After all, never say never.

For example, let’s say you’re trying to calculate a company’s P/E multiple. In this case, you’d use the stock’s current stock price for the numerator and Diluted EPS for the denominator.

Using Basic EPS in the denominator would be a rookie mistake. Don’t do it.

How to Increase Diluted EPS

From an investor’s perspective, the higher the Diluted EPS the better. That’s because a higher EPS means the company is earning more profit for each share. If we own a company’s stocks, we naturally want the company to earn as much profit per share as possible.

So how can companies increase Diluted EPS? Well, based on the formula, there’re really two levers that companies can pull. They must either increase Net Income or decrease Diluted WASO.

To increase Net Income, they must either increase Revenue or decrease Cost. To increase Revenue, they must either sell more product units or raise pricing. To decrease cost, they must reduce at least one of Cost of Goods Sold, Operating Expenses, Interest Expense, or Taxes.

To decrease Diluted WASO, they must do share buybacks. Alternatively, companies can also find ways to let dilutive securities expire without causing dilution. Such methods could potentially be painful and so it’s debatable whether they’re beneficial.

These are the different ways companies can increase Diluted EPS.

Learn More

At Lumovest, we’re building the place where anyone can learn finance and investing in an affordable and easy-to-understand manner. Our courses are far more intuitive, visualized, logical and colloquial than your college professor-taught courses. Our courses are taught by Goldman Sachs investment banker who has worked on transactions worth over $50 billion. We designed our courses to prepare you to succeed in the world of high finance. You’ll learn how to conduct financial analysis exactly like how it’s done on Wall Street’s top firms. Upon completion of the courses, you will receive our Global Financial & Investment Analyst (GFIA) certification. You can sign up here.

Discount Period

By Valuation No Comments

What is Discount Period?

The Discount Period in a DCF is the length of time that we need to discount future cash flow. It’s usually the length of time between the date cash flow occurred and the date we’re trying the value the security as of.

Discount Rate

By Valuation No Comments

What is Discount Rate?

Discount Rate is the rate of return that investors require on an investment. The Discount Rate for stocks is known as Cost of Equity. Similarly, the return required for debt is known as Cost of Debt.

Do we care more about UFCF or LFCF in LBO?

By Investment Banking Interview Questions No Comments

The investment banking interview question we’re going to go over today is “Do we care more about UFCF or LFCF in LBO?” UFCF stands for Unlevered Free Cash Flow whereas LFCF stands for Levered Free Cash Flow. Here’s what you should say.

Interview Answer

“In an LBO, we care more about LFCF.”

That’s it. Stop. Usually, the interviewer will follow up and ask you “Why?” Then you can explain the rationale.

“We care more about LFCF because it’s after deducting interest expense and so we can use it to calculate how much cash the private equity firm can use to repay the principal on the debt they borrowed.”

Additional Tip

That’s how you should answer this question: “Do we care more about UFCF or LFCF in LBO“. The most common mistake I hear candidates say is that they care more about Unlevered Free Cash Flow in an LBO. Their reasoning is that UFCF is before debt and so that’s a great starting point to subtract all the debt obligations you need to pay in an LBO. We can understand why they would think that. But just know that mechanically, that’s not how the LBO model works. We care about Levered Free Cash Flow. If you want to gain a deeper understanding on this topic, check out the courses on our website.

More IBD Interview Questions

How would you value an apple tree?

Should we use forward multiples or trailing multiples?

How do you select which companies to use in your comps?

Earnings per Share

By Accounting No Comments

What is Earnings per Share?

Earnings per Share (EPS) is the company’s profit entitled to each stock. It measures the profits the company earned for each share in a given period.

There are two types of EPS. Basic EPS and Diluted EPS.

EBIT

By Accounting No Comments

What is EBIT?

EBIT is a metric that measures the profit generated by the business operations. It‘s an acronym that stands for Earnings Before Interest and Taxes. This profit metric accounts for all of the company’s income and expenses, except non-operating items, interest, and taxes. What we have at the end, is therefore a profit metric that measures solely the earnings from the core business operations.

Another name for EBIT is “Operating Income”. Companies often label Operating Income as opposed EBIT on the Income Statement.

EBITDA

By Accounting 3 Comments

What is EBITDA?

EBITDA is a non-GAAP metric that measures the cash profit generated by the business operations. It stands for Earnings Before Interest, Taxes, Depreciation and Amortization. It’s calculated as EBIT plus Depreciation and Amortization (D&A).

Effect of Exchange Rate Changes on Cash

By Accounting No Comments

What is “Effect of Exchange Rate Changes on Cash”?

“Effect of Exchange Rate Changes on Cash” refers to the changes in the value of a company’s cash balance due to fluctuations in foreign currency exchange rates. It’s a common line item on the Cash Flow Statement. Companies that operate 100% domestically with no foreign commercial activities are unlikely to have this line item. On the contrary, companies that conduct business abroad will likely possess this line item. Since many publicly-traded companies are multi-national corporations, many public companies report this line on the Cash Flow Statement.

Reporting Currency

Every company reports their financial statements in a particular currency. Companies in the United States usually report their financial statements in the US Dollar. Likewise, companies in Europe often report their financial statements in Euro or the British Pound. Similarly, companies in China report their financial statements in the Chinese Yuan. The Reporting Currency is the currency in which the company prepares its financial statements.

Functional Currency

By contrast, large multi-national companies often conduct business beyond their home country. Due to their overseas presence, they often deal with the foreign currencies of whichever country their operations are located. Each country will have its own official currency. Functional Currency is the currency of the primary economic environment in which an entity operates.

“Effect of Exchange Rate Changes on Cash” Example

For example, Tesla is an American company with significant overseas presence in China. Tesla’s US entity sells the vehicles to American consumers in US Dollars. Its US bank account will store its cash in US Dollars. Therefore, the Functional Currency of the Tesla US entity is US Dollar. However, the Tesla China entity sells vehicles to Chinese consumers in Yuan. Its China bank account will store its cash in the Yuan. Therefore, the Functional Currency of Tesla’s China entity is the Yuan. Similar concept applies to Tesla’s UK entity. The UK entity sells Tesla vehicles to British consumers in the Pound. Tesla’s UK bank account will store its cash in the Pound. Consequently, the Functional Currency of Tesla’s UK entity is the Pound.

Because of Tesla’s presence in many difference countries, it has many different Functional Currencies. However, when Tesla reports its financial statements, it has to report the numbers in the US Dollar. In other words, Tesla’s Reporting Currency is the US Dollar. On the Balance Sheet, the company must report its Cash & Cash Equivalents balance in US Dollar. This requires the company to convert each Functional Currency into the Reporting Currency.

Similar to stock prices, foreign currency exchange rates change every minute. Therefore, the value the Functional Currencies converts into the Reporting Currency will vary based on the exchange rates. Companies can have no changes to their bank account for an entire year and the value of the Cash & Cash Equivalents balance in the Reporting Currency will still change because of the constant fluctuations in foreign currency exchange rates.

Impact on the Cash Flow Statement

“Effect of Exchange Rate Changes on Cash” is important because it changes companies’ cash balance in the Reporting Currency. It is usually situated at the bottom of the Cash Flow Statement, immediately after Cash Flow from Financing. Most times, it will either increase or decrease the companies’ cash balance in the Reporting Currency. Rarely does it have neutral impact because rarely do currency exchange rates remain exactly the same.

For example, here’s the “Effect of Exchange Rate Changes on Cash” from McDonald’s Cash Flow Statement. McDonald’s is an American company with US Dollar as its Reporting Currency. However, it operates throughout the world with many different Functional Currencies. It’s no surprise then that foreign currency exchange rates can significantly affect the company’s cash balance.

Effect of Exchange Rate Changes on Cash and Cash Equivalents Example

Conclusion

“Effect of Exchange Rate Changes on Cash” refers to the changes in the value of a company’s cash balance due to fluctuations in foreign currency exchange rates. It exists because companies’ Functional Currencies may differ from their Reporting Currencies. It appears towards the bottom of the Cash Flow Statement.

Enterprise Value

By Valuation 5 Comments

What is Enterprise Value?

Enterprise Value (EV) is the value of a company’s business operations. Enterprise Value is calculated as Equity Value plus Debt Outstanding minus Cash & Cash Equivalents minus Investments. It’s the price to buy the entire business as a whole and is a key valuation metric.

Equity Risk Premium

By Valuation No Comments

What is Equity Risk Premium?

Equity Risk Premium (ERP) is the additional returns investing in the stock market provides, in excess of the Risk-Free Rate.

ERP = Stock Market Return – Risk Free Rate.

Equity Value

By Valuation No Comments

What is Equity Value?

Equity Value is the value of a company available to its owners. The company owners are shareholders. Therefore, Equity Value is the value of the company that belong to shareholders.

Equity Value = Stock Price x Shares Outstanding.

Financial Statements

By Accounting No Comments

What are Financial Statements?

Financial Statements are reports showing a company’s financial performance over a period of time. There are five types of financial statements.

  1. Income Statement
  2. Cash Flow Statement
  3. Balance Sheet
  4. Statement of Comprehensive Income
  5. Statement of Changes in Equity

While there are five statements, not all of them are created equal. The Income Statement, Cash Flow Statement and Balance Sheet are by far the most important. They often shed the most relevant insight into the company. Therefore, these three are the major financial statements and are indispensable to investment analysis.

Independent accounting firms often audit these reports to certify that the numbers are fair and in compliance with accounting principles.

Free Cash Flow

By Valuation No Comments

What is Free Cash Flow?

Free Cash Flow (FCF) is the amount of cash generated during a period that can be given back to the company’s investors after all the necessary expenses and investment activities have been paid for. FCF is an extremely important metric in financial analysis. It’s the actual amount of value earned for investors over a period of time. There are two types of FCF: (1) Unlevered and (2) Levered.

GAAP

By Accounting No Comments

What is GAAP?

GAAP stands for Generally Accepted Accounting Principles. It’s a set of accounting principles and procedures that companies must follow when preparing their financial statements. The US GAAP governs American companies while the IFRS governs European companies.

Gain on Sale of Asset

By Accounting No Comments

What is Gain on Sale of Asset?

Gain on Sale of Asset is the gain achieved from selling an asset at a higher price than the Balance Sheet book value. The amount of gain is the difference between the cash proceeds from the sale and the Balance Sheet book value. Companies record this gain as an income on the Income Statement.

Goldman Sachs HireVUE Questions – Investment Banking and Early Careers

By Careers, Investment Banking Interview Questions No Comments

In this article, we’re going to guide you through the Goldman Sachs HireVUE questions, particularly for investment banking and early careers. After you submit your online application, Goldman Sachs Human Capital Management (“HCM”) will review in the backend. If they choose to move you forward, you will receive an email with a link to the HireVUE interview. Clicking on the link will bring you to HireVUE’s website with your unique identification code.

Goldman Sachs HireVUE Questions (boiler plate)


How Goldman Sachs HireVUE Works

Once you arrive at the HireVUE website, the website will automatically test your microphone and your web camera. It’s a good idea to test these two devices and your Internet connection before starting HireVUE. Once that’s done, HireVUE will ask you if you’d like to do a practice question first. If you’ve never done a HireVUE interview before, you should absolutely take this practice question.

Once you finish the practice question, you can begin the actual HireVUE interview. In the real interview, HireVUE displays each question sequentially, one by one. You can’t jump ahead and you can’t go back. So you can only see the current question.

They’ll show you a question, after which you’ll have 30-45 seconds to prepare your answer. After the preparation time is up, the recording begins and you must deliver your answer. Historically, all Goldman Sachs HireVUE questions give candidates 2 minutes to answer each question. This may and likely will change time-to-time, so don’t follow this 2-minute budge religiously. After the recording ends, you have the option to watch your recorded answer to the question. You have one retry life for each question. Therefore, if you don’t like your recorded response for whatever reason, you can re-do it once. Once you submit your answer to the current question, the system will bring up the second question. This sequence repeats until you finish all questions.

So what are some real examples of Goldman Sachs HireVUE questions? That’s what we’ll show you next.


Goldman Sachs HireVUE Question #1

HireVUE Question: You are working on a highly confidential project with another manager and her work group.  Your manager is not involved with the project and does not have access to this information. He asks you for access to the project’s results to help him make an important business decision. What would you do?

Lumovest Analysis: This question is testing whether you are someone who has enough awareness. There’re no rules that specify what you should operate in this situation. However, you should know that Goldman Sachs is very secretive about client information and project information. Sensitive information are shared internally only on a “need-to-know” basis. Anyone within Goldman Sachs who does not “need” to know the information should not obtain the information. Consequently, in this question, you have to balance navigating the manager relationship and protecting confidential information.

Sample Answer

In this scenario, I’m working on a highly confidential project with another group. My manager is not involved but asks me for the project’s results to help him make an important business decision. I know that as an employee of the firm, I have a responsibility to protect the information. One of the firm’s four core values is Client Service. It differentiates Goldman Sachs from competition by serving as a trusted advisor to clients. Part of that trust comes from protecting confidential information, both internally and externally. This is especially the case here since the project is emphasized to me as highly confidential. And so I would not tell him about the project results on the spot just because he’s my manager.

This is especially the case since it is uncertain whether the business decision is personal in nature. I’m mindful of the fact that he is my direct supervisor and so I think I should be very respectful. As a summer intern, I don’t think I would probe him about the nature of that business decision. If it’s personal, my question might embarrass him and make him feel self-conscious. And if it’s firm-related, it might involve other confidential information that I shouldn’t be privy to.

Rather, I would do two things. First, I would inform him that the group is very strict and protective of the results. Second, I would offer to bring up his request to access the results with the project manager. I think if he is asking on a “need-to-know” basis, he would be willing to speak with the project manager. And the project manager should decide whether to grant him access to the results. So that’s what I would do in this situation.


Goldman Sachs HireVUE Question #2

HireVUE Question: Provide an example of when you were in an unfamiliar setting with people from different experiences, perspectives, and backgrounds. What did you specifically do to create an inclusive environment?

Lumovest Analysis: Two things that Goldman Sachs really value are diversity and teamwork. The firm has one of the best track records of hiring diverse talent. Due to the nature of this diversity, its employees come from a wide array of backgrounds and experiences. HCM (Goldman’s HR) wants to know that you are someone who embraces diversity. It also wants to know that you are a good team player who makes other team members feel comfortable. Also, please note that you don’t have to position yourself as a leader in your answer to this question.

Sample Answer

In my freshman summer, I had studied abroad in the United Kingdom at the London School of Economics. Having spent all my life in the United States, the UK was completely foreign to me. The students in our summer exchange program are not locals. Rather, they come from all over the world, such as France, China, Germany, Argentina, Abu Dhabi, India, Russia, etc. It was very clear from the orientation events that my classmates come from a wide range of backgrounds and hold very different perspectives on life. We are all minorities in this program. I wasn’t a leader of our group by any means, but I did try to do my part.

To create a more inclusive environment for everyone, we took turns organizing study events and extracurricular activities and outings together. One time, after a group study session, the team wanted to grab dinner together in a popular area in London. Most of the students had already finished their work and so people started leaving towards the restaurant. But there were 3 other students from [Country A] who were still wrapping up their work. Because everyone else who left were not from [Country A], I was cognizant of how the 3 students might feel. I didn’t want the 3 remaining classmates to feel like we’re abandoning them. And so I volunteered to stay behind to wait alongside them until they finished. We then proceeded to walk towards the restaurant together. So this is a recent example of a situation where I contributed to a more inclusive environment.


Goldman Sachs HireVUE Question #3

HireVUE Question: What kind of barriers have you had to overcome in the past in order to be successful in a particular job or assignment? What was the situation? How did you deal with these barriers? What was the outcome? Please describe in detail.

Lumovest Analysis: Barriers could be any obstacles – disabilities, discrimination, financial disadvantage, family obligations, lack of resources, etc. Think of times when you’ve had to work hard to attain something. Try to spin that into an answer.

Sample Answer

I grew up in a remote town in Arizona, about 2 hours of drive outside of Phoenix. As a child, I was always a loyal viewer of WWE. Even though I’m a girl and I knew WWE was staged, it was still very interesting to me. But I never had a chance to really get into it and learn it.

But in 2016, I was watching the Rio Olympics and cheering for Team USA. That’s when I discovered wrestling as a sport. I had no idea that wrestling as an actual sport even existed because my middle school didn’t offer it. I was so excited about this sport and started following the Olympics wrestling games. Watching the women of Team USA win their gold medals was so motivating and inspirational. My parents always wanted me to pick up a sport, but I never felt a connection to any sport except this one. I was determined – I wanted to learn how to wrestle.

But where I grew up in Arizona, wrestling was not a very popular sport. People were a lot more into basketball, football, and even swimming due to the Arizona weather. I searched for wrestling classes near me but there is none. The nearest place that offered wrestling lessons was at a high school about an hour away. I was able to convince them to allow me to learn how to wrestle there.

The travel was very time-consuming. The back and forth took two hours every day but it felt very fulfilling. The travel is just one of the barriers. Because I’m was in middle school at the time, I had to wrestle students a few years older than me. But that didn’t discourage me. In fact, it motivated me to practice harder knowing my opponent is so much stronger. Eventually, I opted to attend this high school after graduating from my middle school and represented the school to win several district and state championships.


Goldman Sachs HireVUE Question #4

HireVUE Question: You are conducting a research study for a student organization to investigate the biggest challenges facing students at your school. You need to determine the best method for collecting this information from students and teachers. How would you decide on your method?

Lumovest Analysis: This question is really asking is you to demonstrate organization skills. Goldman is attempting to assess your ability to solve problems in a structured manner. You should identify the audience and then the criteria you will use to choose the best method.

Sample Answer

I’m conducting a research study on the biggest challenges facing students at my school and I have to determine the best method for collecting this information from students and teachers. First, I would study the school’s student body to make sure I collect from a sample set of students and faculty that’s somewhat representative of the school as a whole. That includes both undergraduates and graduates, students of different classes and different majors, and similar idea for the faculty.

There are many different ways we can go about collecting this information. As my second step, I would think through the constraints and requirements of this exercise. For example, I would consider things such as how quickly we need to gather this data, our budget, the scope of the challenges we’re looking for, whether they’re academic challenges or life challenges, convenience for the students and faculty, and motivation for them to speak the truth.

As my third step, I would brainstorm the different ways I can go about collecting this information. Once I have the different ways, I would set them up on a piece of paper side by side. I can compare these different methods based on the key constraints and requirements that I identified earlier. Based on this analysis, I can pick the method that best meet my needs.


Goldman Sachs HireVUE Question #5

HireVUE Question: What is your understanding of investment banking and why do you think your skillset is a good fit?

Lumovest Analysis: This question is division-specific. You won’t get this question unless you’re applying to the Investment Banking Division. However, you might get the equivalent of this question for whatever division you apply to. Even though the question didn’t mention it, you should also explain your interest. So the formula is: Interest + Skillset = Fit.

Sample Answer

My understanding of investment banking is that the firm advises clients on mergers & acquisitions and capital raising. In an M&A transaction, the firm would advise corporate clients on the purchase or sale of businesses. And in capital raising, the firm would help corporate clients raise capital either through issuing shares or by borrowing debt. The work requires putting together robust financial models, creating presentations and leading the due diligence process. It’s a very impact professional that requires strong analytical, work ethics and attention to details.

I’m very interested in investment banking because of the ability to make significant impact. Through M&A and financing transactions, investment banking can transform industries. It can help businesses obtain the capital they need to grow and create better products for the market. And I think that’s very meaningful.

Personality-wise, I’m a very analytical person. I’m currently double-majoring in Mathematics and Finance. I enjoy diving into the numbers to figure out the underlying story. I’m also very hardworking. In addition to my heavy course load at school, I also spent the last two summers interning at two different companies. The experiences taught me the importance of diligence, without which I can’t become better at what I do. And lastly, I’m very attentive to details. At the end of my last summer internship, my boss gave me a formal review. One of the things that he said I did really well was that I was thoughtful of the details.

And so in summary, I think I’m a good fit for this role because I’m very interested in the work and because I have good analytical skills, work ethics and attention to details.


Are There No Technical Questions?

Goldman Sachs HireVUE questions for students usually do not consist any technical questions. So HireVUEs for Summer Analysts and Summer Associates are almost always behavioral in nature. On the other hand, the Goldman Sachs HireVUE questions for experienced professionals may consist of technical questions. However, even in these situations, the technical questions are very simple and straightforward. Nothing complicated. In other words, you don’t have to worry about technicals for Goldman Sachs HireVUE questions.


Preparing for the Next Round after HireVUE

After you pass Goldman Sachs HireVUE questions, the next step is in-person interviews. These interviews can potentially be highly technical in nature. Having a strong finance technical foundation is a must.

Lumovest is the finest institution in the world to learn financial and investment analysis. Our courses are taught by Goldman Sachs investment banker. You’ll learn how to analyze financials and investments like how Goldman Sachs teaches its analysts and associates. Our lessons are interactive and visually intuitive. As a result, our courses are very practical and very relevant to what you’ll do on a day-to-day basis. By the end of the program, you’ll be able to conduct financial analysis on companies from the grounds up.

Developing a strong financial analytical skillset will help you stand out during the Goldman Sachs hiring process. Through our courses, you’ll learn accounting, financial modeling, LBO, DCF, M&A and valuation. At the end, you’ll receive an official blockchain-verified digital certification, which you can showcase on your resume. You can sign up here.


Related Readings


Goodwill Impairment

By Accounting No Comments

What is Goodwill Impairment?

Goodwill Impairment is an expense that reflects a reduction in the value of Goodwill on the Balance Sheet. The impairment occurs if the carrying value exceeds fair market value.

Gross Profit

By Accounting 3 Comments

What is Gross Profit?

Gross Profit is the profit generated from goods and services sold. It measures the profitability of products. It’s the difference between revenue from these products and the cost to provide these products. Gross Profit = Revenue – Cost of Goods Sold.

How do we decide between using EV/EBITDA vs EV/Sales?

By Investment Banking Interview Questions No Comments

The investment banking interview question we’re going to go over today is “How do we decide between using EV/EBITDA vs EV/Sales?” There are so many different multiples out there. How do you choose which multiple to use to value a company? Here’s what you can say.

Interview Answer

“In general, I would use EV/EBITDA to value businesses because EBITDA represents profit whereas EV/Sales neglects the impact of cost. However, there are three situations where I would place greater emphasis on EV/Sales.  

First, if the company has negative EBITDA, then EV/EBITDA would not be meaningful. In this case, I’d use EV/Sales instead of EV/EBITDA.

Second, if the company has positive EBITDA, but it’s very tiny relative to the Enterprise Value, then EV/EBITDA would be some really big number. That would also not be meaningful and I’d use EV/Sales instead.

Third, if the company is very high growth and faces evolving cost structure such that its current costs are not representative of what it’ll incur in the future, then I may choose to use EV/Sales instead because it’s a better reflection of the company’s future earnings potential.

So that’s how I’d choose between EV/EBITDA and EV/Sales.”

Additional Tip

In short, that’s how you answer the question: “How do we decide between using EV/EBITDA vs EV/Sales”. Now to be honest, this is a very silly question. This question implies that bankers use only one multiple to value a company. But in reality, bankers just show the valuation across different multiples. This means the interviewers are kind of asking you things that they don’t even do at work. So that’s why it’s silly. But nonetheless, you still have to know how to answer the question.

More IBD Interview Questions

What are the different valuation methodologies?

Which valuation method gives the highest valuation?

How does raising debt affect a company’s P/E multiple?

How do you project expenses?

By Investment Banking Interview Questions No Comments

The question we’re going to go over today is “How do you project expenses?” This question is very similar to what we covered previously about how we’d project revenue. You should check that out too if you haven’t seen that video yet. Anyways, let’s get into how we’d craft the answer to this interview question.

Interview Answer

“In general, there are three different ways to project cost. The first way is to project cost using a growth rate. We can take last year’s expense and increase it by the growth rate.  

The second way is to project cost by tying them to revenue. For example, we can calculate the cost as a percentage of revenue. By multiplying this percentage to the projected revenue, we’ll arrive at the projected cost.

And lastly, we can project cost through a more detailed expense build. For example, we can project out the different components that go into Cost of Goods Sold, such as direct materials, labor cost, shipping cost, and others and then add them up to calculate the future cost. 

So these are the three different ways we can we project expenses.”

Additional Tip

That’s how you can answer this interview question: “How do you project expenses”. You can also talk about factors that you would take into consideration when you make your forecast, but that’s generally not required.

Other IBD Interview Questions

Walk me through an LBO model

What are the major SEC filings?

How do you project revenue?

How do you project revenue?

By Investment Banking Interview Questions No Comments

The investment banking interview question we’re going to go over today is “How do you project revenue?” Generally speaking, there are three ways to project revenue. Let’s take a look at how you might deliver this answer in a real interview.

 Interview Answer

“In general, there are three different ways to project revenue. The first way is to project revenue using a growth rate. We can take last year’s revenue and increase it by the growth rate.

The second way to project revenue is through a bottom-up revenue build. We would project out the different revenue streams individually and then add them together to calculate the future total revenue.

And lastly, we can project revenue through a top-down revenue build. Using this method, we can multiply the total market size and the approximate percentage share that this company can capture, and this will give us the projected future revenue.

So these are the three different ways we can we project revenue.”

Additional Tip

That’s how you can answer this question: “how do you project revenue”. You can also talk about factors that you would take into consideration when you make your forecast, but that’s generally not required.

Other IBD Interview Questions

Walk me through a merger model.

Walk me through an LBO model.

What are the major SEC filings?

How do you select which companies to use in your comps?

By Investment Banking Interview Questions No Comments

The investment banking interview question we’re going to go over today is “How do you select which companies to use in your comps?” Here’s what you should say.

Interview Answer

“In general, we select peers based on similarities in business, geography, and financials.  

First, I would narrow my selection down to companies operating in the same business. Ideally, these companies are direct competitors to our company in question because that means there’s very close resemblance.

If there’s a long list of names, I would narrow them down further by screening for companies located in the same country as our company. That’s in terms of both where they are listed and where they derive most of their revenue from.

And if there’s still a long list of names after this, then I would add an additional filter to find companies that also share similar financial characteristics, such as revenue size and margins. That’s how I’d go about choosing my comps.”

Additional Tip

In short, that’s how you should answer the question: “How do you select which companies to use in your comps”. Long story short, the three criteria you would use to screen for comps are resemblance in business, geography and financials.

More IBD Questions

How do we decide between using EV/EBITDA vs. EV/Sales?

How would you value an apple tree?

Should we use forward multiples or trailing multiples?

How does $10 increase in D&A affect UFCF?

By Investment Banking Interview Questions No Comments

The investment banking interview question we’re going to go over today is “How does $10 increase in D&A affect UFCF?” UFCF stands for Unlevered Free Cash Flow. Here’s what you should say.

Interview Answer

“If D&A increases by $10, then EBIT will decrease by ten. Assuming a 20% tax rate, NOPAT decreases by eight. Then we need to add back the extra $10 of D&A because it’s a non-cash item. So Unlevered Free Cash Flow increases by two.”

Additional Tip

And there you have it. That’s how you can deliver this answer to this question: “How does $10 increase in D&A affect UFCF”. Conceptually UFCF increases by $2 because the higher D&A expense results in higher tax savings. That $2 of higher UFCF comes from the lower tax expense.

More IBD Interview Questions

Should we use forward multiples or trailing multiples?

How do you select which companies to use in your comps?

Do we care more about UFCF or LFCF in LBO?

How does $10 increase in debt affect the financial statements?

By Investment Banking Interview Questions No Comments

The investment banking interview question we’re going to go over today is “How does $10 increase in debt affect the financial statements?” This is a much easier accounting question than the $10 increase in depreciation question. You should check out that article if you haven’t seen it yet. Here’s how you should answer it.

Interview Answer

“Nothing changes to the Income Statement, so everything stays the same.

On the Cash Flow Statement, no changes to Cash Flow from Operations and Cash Flow from Investing. But under Cash Flow from Financing, Proceeds from Issuance of Debt goes up by $10. And so total Net Change in Cash goes up by $10.

On the Balance Sheet, under the Assets side, Cash and Cash Equivalents increases by $10. Under the Liabilities and Equity Side, Debt increases by $10. And the Balance Sheet balances.”

Additional Tip

That’s how you should answer the question: “How does $10 increase in debt affect the financial statements”. This is a pretty simple one. The other more advanced 3-statement accounting questions can be a lot more complicated. The key here is to walk the interviewer through the changes step by step. Don’t jump around.

More IBD Interview Questions

Projecting revenue

Projecting expenses

How does $10 increase in depreciation affect the financial statements?

How does $10 increase in depreciation affect the financial statements?

By Investment Banking Interview Questions No Comments

The investment banking interview question we’re going to go over today is “How does $10 increase in depreciation affect the financial statements?” This is a critical question. It’s so important because it’s the foundation of 3-statement accounting questions. Here’s how you should answer it.

Interview Answer

“Starting with the Income Statement, Depreciation goes up by $10, which causes Pre-Tax Income to decrease by 10. Assuming a 20% tax rate, Net Income decreases by 8. 

On the Cash Flow Statement, under Cash Flow from Operations, Net Income decreases by 8. But we need to add back the $10 increase in Depreciation because it’s a non-cash expense. And so Cash Flow from Operations increases by 2. No changes to Cash Flow from Investing and Cash Flow from Financing, so total Net Change in Cash goes up by 2.

On the Balance Sheet, under the Assets side, Cash and Cash Equivalents increases by 2. But PP&E decreases by 10 because of the extra Depreciation. So Total Assets decreases by 8. Under the Liabilities and Equity Side, Retained Earnings decreases by 8 due to Net Income. And the Balance Sheet balances.”

Additional Tip

That’s how you should answer this question: “How does $10 increase in depreciation affect the financial statements”. Here’s something really important. Anytime you get these how-does-this-affect-three-financial-statements question, you have to be thoughtful about the structure of your answer. Getting the answer right is the basics. You also have to prove to the interviewer that you can organize your thoughts into a very organized manner, like what we just demonstrated.

More IBD Interview Questions

What are the major SEC filings?

How do you project revenue?

How do you project expenses?

How does raising debt affect a company’s P/E multiple?

By Investment Banking Interview Questions No Comments

The IBD interview question we’re going to go over today is “How does raising debt affect a company’s P/E multiple?” This is a somewhat challenging question often asked by Goldman Sachs San Francisco. We’ve seen this question being asked to Summer Analyst and Full-Time Analyst candidates for the GS SF office. Here’s how you can craft your answer.

Interview Answer

“The impact is indeterminate. When a company raises debt, there are factors pushing up the P/E multiple but there are also factors pushing it down.  

For example, when a company raises debt, debt becomes a greater proportion of its capital structure. So it gets a higher weighting when calculating WACC. Since Cost of Debt is cheaper than Cost of Equity, that will reduce WACC, which will increase Enterprise Value. That increase in Enterprise Value flows down to Equity Value, which pushes up the P/E multiple. But on the other hand, the debt could come with restrictive covenants, which could limit the company’s ability to reinvest in future growth. That could push the P/E multiple down.

And so raising debt wouldn’t definitively increase or decrease P/E multiple. It varies on a case-by-case basis.”

Additional Tip

In short, that’s how you can answer the question: “How does raising debt affect a company’s P/E multiple”. It depends on the situation and varies from company to company. You can learn more about this particular question here. The biggest mistake candidates make for this question is by sticking to a firm stance that raising debt would increase or decrease the multiple.

More IBD Interview Questions

What is non-controlling interest and why do some companies have it?

What are the different valuation methodologies?

Which valuation method gives the highest valuation?

How would you value an apple tree?

By Investment Banking Interview Questions No Comments

The investment banking interview question we’re going to go over today is “How would you value an apple tree?” This question is actually a lot easier than it seems. Here’s what you can say for this interview question.

Interview Answer

“There are several ways I can value an apple tree.  

First, I can try to estimate how many apples the tree will produce every year and multiply it by the going market price per apple to estimate annual sales. Then, I’ll subtract costs and any CapEx I have to pay to care for the tree. That’ll give me the yearly free cash flow I’ll get from the apple tree. I can project that forward and then calculate the apple tree’s discount rate. Finally, I would discount the future free cash flow back to the present, which would tell me the apple tree’s intrinsic value.

Alternatively, I can also look at what similar apple trees have been sold for in the market. I can analyze these comparables on a Value per Apple basis. And then I can apply this multiple to the number of apples that our tree has and that’ll tell me the value of our apple tree.

So that’s how I’d go about valuing the apple tree.”

Additional Tip:

In short, this is how you answer the question: “How would you value an apple tree”. This is actually a super easy question. All you’re doing here is walking them through DCF and comps, but swapping out the generic objects for an apple tree. In fact, this is what you should do anytime you get a “how do you value something” question. Just do a DCF and comps, and swap out the generic objects for that particular thing.

More IBD Interview Questions

Which valuation method gives the highest valuation?

How does raising debt affect a company’s P/E multiple?

How do we decide between using EV/EBITDA vs EV/Sales?

Impairment Charge

By Accounting 3 Comments

What is Impairment Charge?

Impairment Charge is an expense that reflects a reduction in the carrying value of an asset on the Balance Sheet. The impairment occurs when the carrying value of a particular asset on the Balance Sheet exceeds its fair market value. While any asset can suffer impairment, the most commonly impaired assets are inventory, PP&E, intangible assets and goodwill.

Income Statement

By Accounting No Comments

What is an Income Statement?

The Income Statement shows the company’s revenue, cost and profits over a period of time. Along with the Cash Flow Statement and Balance Sheet, it’s one of the three main financial statements. You can think of it as a financial report that tells you how much money the company made during the period. Pretty much all of the highest paying finance jobs would require a strong understanding of this financial statement.

The Income Statement adds up all the sources of income and subtracts all expenses. What it has at the end, is profit, also known as “the Bottom Line”.

Income Statement Concept Image

The Bottom Line

A key takeaway from an Income Statement is how much profit the company earned during the reporting period. This financial statement starts with revenue, which is often the biggest source of income, adds other incomes and subtracts expenses.

If the company generated more income than cost during the period, it’ll record a profit. This is known as Net Income or Net Profit. But if the company incurred greater cost than what it generated in income, it’ll record a loss. This is known as Net Loss. Either way, the Net Profit / Loss number is often show at the bottom of the report. For this reason, it’s also known as the “Bottom Line”.

The Net Income / Net Loss number is the key takeaway from the Income Statement. That’s why the Income Statement is known as “Statement of Profit & Losses” or “Statement of P&L”. P&L is just an abbreviation for Profit & Losses. So the next time someone talks about P&L, you should know that they’re referring to the Income Statement. And because P&L is the key financial metric that characterizes a business operations, the Income Statement is sometimes also called the “Statement of Operations”.

Underneath Net Income, publicly-traded companies will also show Net Income per Share. This represents the profit earned for each share given how many shares the company has outstanding. Whereas Net Income represents the total profit for the entire company, Net Income per Share represents the piece of the profit entitled by each share. This is also known as Earnings per Share or EPS.

Essentially, the Income Statement shows how the money made from selling products is transformed into profits and profit per share.

Income Statement Example

Here’s a real Income Statement example for Snapchat (NYSE:SNAP). You can find this example on PDF page 68 of Snap’s annual report.

Snapchat Income Statement Image

As you can see, this financial report starts with Revenue, and then subtracts expenses and adds other sources of income. In this case, the total expense is greater than total income, so the company is incurring a Net Loss.

First, notice that Snap’s Income Statement is called “Consolidated Statements of Operations”. This is common. Publicly-traded companies will usually call it “Statements of Operations” in official documents as opposed to “Income Statement”. That’s because “Statement of Operations” sounds more official than “Income Statement”. However, content-wise, it’s the same as Income Statement. Therefore, if you’re looking for Income Statements of publicly-traded companies, you should search for “Statement of Operations” instead.

Second, notice that the numbers are presented “in thousands, except per share amounts”. This means that data related to financials per share are presented as-is. In other words, $2.95 of net loss per share means exactly $2.95. Not $2,950. However, all other numbers are shown in thousands. In Snapchat’s Income Statement, that means all the numbers between Revenue and Net Loss are shown in thousands. Same thing goes for “weighted average shares used in computation of net loss per share”.

And third, notice that the Income Statement often shows several years of data. It’s standard for companies to show several years of data across the columns. They do this so readers can easily see how the company performed over time. Setting consecutive years’ data side-by-side makes it easy for analysts to identify patterns. On a related note, notice that the periods are clearly labeled. “Year Ended December 31” to let readers know that the numbers reflect performance over a one year period.

Income Statement Format

Now we know what the Income Statement is and what it looks like. It’s time to learn the Income Statement format and how it’s structured. Broadly speaking, there are two types of Income Statement formats: Single-Step Income Statement and Multi-Step Income Statement.

Single-Step Income Statement:

The Single-Step Income Statement is a format showing the calculation to Net Income / Net Loss through a single step. It simply subtracts total expenses from total income (Revenue and other incomes). Here’s what a Single-Step Income Statement would look like.

Single-Step Income Statement Image

Single-Step Income Statements are generally used by small to medium sized and privately-held companies. Large-sized, publicly-traded companies rarely use the Single-Step Income Statement format. Instead, most public-traded companies adopt the Multi-Step Income Statement format.

Multi-Step Income Statement:

The Multi-Step Income Statement is a format that shows the calculation to Net Income / Net Loss through multiple steps. It calculates other profit metrics along the way, before arriving at Net Income / Net Loss. Instead of calculating the bottom line through a single step, the Income Statement makes multiple calculations. It makes a few stops along the way before arriving at Net Income / Net Loss. Here’s the same Income Statement that we used for Single-Step laid out in Multi-Step format:

Multi-Step Income Statement Image

Most large-sized, publicly-traded companies adopt the Multi-Step Income Statement format. They do this because it highlights the company’s various profit metrics. You can think of this as the standard Income Statement format for most large companies. Let’s dig deeper to understand how a standard Income Statement (Multi-Step) is structured.

[Income Statement layout]

The Income Statement always begins with Revenue. Revenue is always the first line on the report. It’s always at the top. For this reason, it’s also known as “the top line”. This stands in direct contrast to Net Income / Net Loss, which is known as “bottom line”.

[Income Statement layout – add cost of revenue]

From Revenue, we subtract Cost of Revenue to calculate Gross Profit. Gross Profit measures the amount of profit purely from what the company sells.

[Income Statement layout – OpEx]

And then from Gross Profit, we add other incomes and subtract all expenses related to the core business operations. Collectively, this gets us to Operating Income. It measures the amount of profit the company generated from its core business operations.

[Income Statement layout – Net Income]

And then from Operating Income, we add and subtract non-operating related income and expenses. This gets us to the Net Income / Net Loss number, which is the bottom line.

See? It takes multiple steps along the way to go from Revenue to Net Income / Net Loss. Hence the name, Multi-Step Income Statement.

The Accounting Principles

Four accounting principles underpin how revenue and expense amounts are recognized. They guide the companies in determining the amount of revenue and expenses to record.

Monetary Unit Principle:

The first principle underpinning the Income Statement is the Monetary Unit Principle. The Monetary Unit Principle states that only transactions measurable in monetary units may be recorded in the company’s financial statements. If something can’t be measured with money, it can’t be recorded on the Income Statement.

Stable Dollar Assumption:

The Stable Dollar Assumption is an assumption that the currency used to prepare the financial statements (U.S. Dollar for American companies) is stable over time, without being affected by inflation or deflation.

Accrual Principle:

The Accrual Principle requires companies to recognize revenue based on when it’s earned rather than when payment is received. For example, suppose a company has delivered goods to a customer who has not yet paid. Under the Accrual Principle, the company should record this Revenue on the Income Statement.

Likewise, the Accrual Principle also requires companies to recognize expenses based on the Matching Principle and when it’s incurred as opposed to when cash payments are made. For example, companies would have to record the month’s utility expense even if they haven’t paid yet.

Small, mom and pop stores are likely to ignore the Accrual Principle. They tend to prepare their financial statements on a cash basis, based on when cash is received and paid. It’s a lot easier for them to track cash movements than it is to track accrued revenue and expenses. However, all publicly-traded companies in the US and Europe will observe the Accrual Principle and prepare their Income Statement accordingly.

Matching Principle:

The Matching Principle requires companies to record expenses on the Income Statement in the same period as the related Revenue. Revenue and related expenses are “matched” together and recorded in the same period. If an expense is directly related to revenue (i.e. cause and effect relationship), it should be recorded in the same period as the corresponding Revenue. If an expense isn’t directly-related to Revenue, the expense should be recorded in the period that it was used.

Income Statement Line Items

Let’s go over the common Income Statement line items. There may be some variations among companies, but the gist is the same. Below, we lay out these common line items in the order they usually appear.

  1. Revenue

    Revenue is the value of goods and services that the business has sold. Companies generally provide their revenue recognition guidelines to explain the criteria they follow to determine whether a transaction is eligible to be recorded as Revenue.

  2. Cost of Goods Sold (COGS)

    Cost of Goods Sold is the cost to provide the goods and services that the business has sold. Companies that sell physical products would call it “Cost of Goods Sold” but companies that sell services or a mix of product and services would call it “Cost of Service” or “Cost of Revenue”.

  3. Gross Profit

    Gross Profit represents the profit generated purely from the goods and services that the business has sold. It’s the difference between Revenue and Cost of Goods Sold. Put another way, it’s the money company sold its products for less the cost of these products.

  4. Research & Development (R&D)

    Research & Development are expenses related to improving existing products or developing new products. They help the business stay competitive and enable the company to launch new products in the future. Not all businesses will have this R&D expense. Hotels and restaurants, for example, won’t have R&D expense. R&D is more common among science and technology-based companies.

  5. Selling, General and Administrative (SG&A)

    SG&A are expenses the company incur to (1) create demand for the business and (2) administer the business. The former is mostly sales and marketing expenses. Costs the company incurred to convince customers to buy its products. It includes items such as advertising fees, marketing team wages, sales commissions, public relations, etc. The latter is mostly expenses to administrate the company. It includes things like corporate office rent and payroll for the corporate staff, such as management, legal, finance, HR, etc. Sometimes companies would break SG&A into two separate lines on the Income Statement. One for Sales & Marketing and another for General & Administrative. However, in many instances, companies lump them together and call it Selling, General and Administrative.

  6. Operating Income

    Operating Income represents the profit generated from running the business operations. It’s the difference between Revenue and all business operating expenses. Think of this as the profit a company earns just from running the business. It doesn’t include income from other sources, such as interest on the cash deposited in the bank. On the Income Statement, companies would often call this “Operating Income” or “Income from Operations” or “EBIT”.

  7. Interest and Taxes

    After recording the P&L for the business operations, the Income Statement accounts for income and expenses aside from the business. These mainly relate to interest income from cash deposited in the bank, and interest expense on debt borrowed. And then after accounting for interest, we subtract Income Taxes.

  8. Net Income

    Net Income is the bottom line on the Income Statement and represents the overall profit of the entire company. It adds up all the incomes (Revenue, interest income, other incomes) and subtracts all expenses (operating expenses, interest, taxes). This is the ultimate amount of profit that the company earned for shareholders during the period.

  9. Weighted Average Shares Outstanding (WASO)

    Weighted Average Shares Outstanding is the average number of shares the company has outstanding during the period. The number of shares outstanding changes over time because companies can issue additional shares or repurchase existing shares.

  10. Earnings per Share (EPS)

    Earnings per Share represents the Net Income the company has earned for each share. It represents the profit each share is entitled to. For this reason, it’s also known as “Net Income per Share”. We can calculate EPS simply by dividing the company’s Net Income by WASO. Whereas Net Income represents what the company earned in total, EPS represents what the company earned for each stock.

Are you starting to see the flow behind the Income Statement? It starts with Revenue. From here, it subtracts Cost of Goods Sold to get Gross Profit, which is the profit of the products sold. Then, it subtracts other operating expenses to get Operating Income. This is the profit of the entire business operations. Then, it accounts for other income and expenses outside of the business, like interest and taxes to calculate Net Income. And finally, it divides the Net Income by the Weighted Average Shares Outstanding to calculate Earnings per Share. What we have at the end is the total profit for all shareholders and the profit entitled to each share.

Income Statement Formula

Now that we know the common line items, let’s learn about the important Income Statement formulas. We’ll lay out the formulas we use to compute (1) certain line items and (2) ratios.

  1. Gross Profit = Revenue – Cost of Goods Sold

    Note that synonyms for Revenue is Sales. And synonyms for Cost of Goods Sold is Cost of Service, Cost of Revenue, and Cost of Sales. Different companies might label things differently, so you can still plug them into this formula. The greater the Gross Profit, the more money the company has left to pay for other operating expenses.

  2. Operating Income = Revenue – All Operating Expenses

    Most publicly-traded companies would explicitly calculate Operating Income on the Income Statement. The calculation is very simple. Simply subtract all of the company’s operating expenses from Revenue and that’s the Operating Income. The greater the operating income means the more profitable the company’s business is.

  3. Net Income = Operating Income + Interest Income – Interest Expense – Taxes

    To calculate Net Income, we can start with Operating Income, add Interest Income, and subtract Interest Expense and Income Taxes. Alternatively, we can start with Revenue, add other sources of income and subtract all expenses.

  4. Earnings per Share = Net Income / Weighted Average Shares Outstanding

    EPS can be calculated by dividing Net Income by WASO. EPS is probably one of the most important line items for a public company. How much EPS a company generates directly affects its stock price.

  5. Growth Rate = (Current Year Metric / Prior Year Metric) – 1

    We use growth rates to analyze the company’s performance trajectory. Healthy businesses grow over time. All else equal, it’s far better to invest in a growing business than a declining business. Similarly, the greater the growth rate, the better. Analysts usually calculate growth rates on Revenue and profit metrics.

    As an example, suppose a company generated $500 of Revenue in Year 1 and $700 in Year 2. Then the growth rate from Year 1 to Year 2 is ($700 / $500) – 1, or 40%.

  6. Profit Margin = Profit Metric / Revenue

    We can calculate profit margin for all the profit metrics by dividing them by the matching Revenue. Divide Gross Profit by Revenue and we have Gross Margin. Similarly, divide Operating Income by Revenue and we have Operating Margin. Margins are usually presented in percentage format.

    As an example, suppose a company generated $180 of Operating Income on $500 of Revenue in Year 1. This means it has an Operating Margin of ($180 / $500), or 36%.

Income Statement Limitations

While the Income Statement can tell us a lot about the company’s profitability, it has 2 major limitations. It doesn’t measure cash flow and it doesn’t paint the full picture of the company’s earnings power.

Does Not Measure Cash Flow:

Revenue and expenses on the Income Statement are recorded on an accrual basis. Recall that we learned about the Accrual Principle and Matching Principle earlier in this article.

Revenue is recognized when goods and services are delivered to customers. Notice that Revenue is not recognized based on when cash is received, but based on when products are provided. For many large businesses, cash is rarely received at the exact same time when goods and services are delivered. Similarly, expense is recognized based on when they are incurred and matched with the corresponding revenue. It’s not recorded based on when they are paid for with cash. That’s why there’re accounts receivables and accounts payables.

Because the Income Statement doesn’t track when cash is received or paid, it doesn’t measure cash flow. Ultimately, the value of a company is based on how much cash flow it’ll generate. For that, we have to turn to the Cash Flow Statement.

Does Not Paint the Full Picture of Earnings Power:

The Income Statement under US GAAP records all income and expenses incurred, regardless of circumstances. This could create a misleading representation of the company’s true earnings power. For example, an Income Statement might show a significant increase in Revenue and profits relative to the prior year. This would give the impression that the business is on a great trajectory. However, this increase could be due to a recent acquisition as opposed to natural organic growth. It’s up to analysts to dissect the numbers and understand the story behind the numbers. Another common issue is that companies could’ve incurred certain one-time expenses. These expenses might’ve been incurred due to unusual events that won’t occur again. As a result, these non-recurring expenses could make the company’s earnings lower than what it’s normally capable of.

Because of these limitations, analysts can’t rely their opinion of a company solely based on the Income Statement. We have to evaluate the company in conjunction with the Cash Flow Statement and the Balance Sheet. We should also make manual adjustments to the GAAP metrics to assess the true underlying earnings power of the business.

Non-GAAP Adjustments

To overcome the limitations of the Income Statement under GAAP, analysts often make adjustments to the earnings metrics. These adjustments are outside of GAAP, so they’re called non-GAAP adjustments. We’ll talk about non-GAAP adjustments in greater detail in a separate article.

Income Tax Expense

By Accounting No Comments

What is Income Tax Expense?

Income Tax Expense is the tax expense a company recognizes based on its corporate income and the government tax rate. Income Tax Expense = Pre-Tax Income (x) Effective Tax Rate.

Interest Income

By Accounting No Comments

What is Interest Income?

Interest Income is the amount of interest a company earns, usually on the cash it has in the banks. When a company deposits cash in a bank, the bank has to pay interest on the cash. Just like how we earn interest in our bank accounts, companies earn interest on their deposits as well. That interest is a source of income for companies.

Whereas Interest Expense is the cost a company accrues for borrowing other parties’ cash, Interest Income is what the company earns for letting other parties (banks) use its cash.

Inventory

By Accounting No Comments

What is Inventory?

Inventory is a company’s products waiting to be sold. In the context of the Balance Sheet, Inventory represents the value of all these unsold merchandises.

Investment Banking in China

By Careers No Comments

Overview of Investment Banking in China

Investment banking in China is a high growth profession, in terms of (i) deal flow, (ii) prestige and (iii) compensation. Driven by its gigantic economy and an increasingly sophisticated financial system, China has developed a thriving investment banking industry.

Similar to the industry elsewhere in the world, the core services of investment banking in China are M&A and financing. China has the world’s second largest M&A market by transaction value, over US$700 billion. In addition, China is home to some of the world’s largest companies, such as Alibaba and Tencent. Naturally, China also has one of the world’s largest financing markets.

List of Top Investment Banks in China

Broadly speaking, there are two types of investment banks in China.

First, there are the global investment banks. These are usually the bulge bracket American and European investment banks. The American investment banks (i.e. Goldman Sachs, Morgan Stanley, J.P. Morgan) are the most prestigious in the Chinese market. Second, there are the native Chinese investment banks. These are domestic banks cultivated in China.

The global investment banks have greater scale, greater resources, and greater brand recognition than the domestic Chinese investment banks. That’s because these global banks operate worldwide and therefore have access to more resources. As a result, prior to the mid-2010s, the global investment banks dominated the Chinese investment banking industry. The global investment banks were and (still are) considered the most prestigious firms. As a result, they historically obtained the most attractive mandates. They win the most deal flow and they also pay their employees the most.

However, by 2021, the Chinese investment banks have made significant progress catching up in their home market. In many cases, the Chinese investment banks surpassed the global investment banks in terms of China deal flow. For example, over 1H’2021, the Chinese investment banks executed more deals in China than their global peers. In China M&A, CICC’s transaction value was more than double that of Goldman Sachs.

Investment Banking in China M&A League Table

In China Equity Capital Markets (ECM), the league table was filled with Chinese investment banks. Among the global investment banks, only Goldman Sachs, Morgan Stanley, Citi and UBS made it to the top 10.

Investment banking in China ECM League Table

In Debt Capital Markets (DCM), none of the global investment banks broke into the top 10. The credit market was dominated by the Chinese investment banks.

Investment banking in china DCM league table

Global Investment Banks

Even though the global investment banks have waning market share in China, their China businesses are still growing. That’s because the Chinese financial markets and economy are growing. Consequently, the global banks are earning more profits from investment banking in China even though their market share is declining. In addition, these global corporations are still considered the most prestigious. Beyond reputation, they also pay the highest compensation.

  • Bank of America (美国银行) (美银)
  • Barclays (巴克莱)
  • Citigroup (花旗)
  • Credit Suisse (瑞士信贷) (瑞信)
  • Deutsche Bank (德意志)
  • Goldman Sachs (高盛)
  • J. P. Morgan (摩根大通) (小摩)
  • Morgan Stanley (摩根士丹利) (大摩)
  • UBS (瑞银集团) (瑞银)

Chinese Investment Banks

The domestic Chinese investment banks significantly increased their capabilities over the past two decades. Not only did they grab market share away from the global investment banks, but they are also expanding overseas.

  • China International Capital Corporation (CICC) (中金)
  • China Securities (中国证券)
  • CITIC Securities (CITIC) (中信)
  • Guotai Junan Securities (GTJA) (国泰君安)
  • Haitong Securities (海通)
  • Huatai Securities (华泰)
  • Industrial and Commerce Bank of China (ICBC) (工商银行)

Salary for Investment Banking in China

Compensation for investment banking in China is pretty straightforward.

The global investment banks have “global pay”. Investment banking analysts in China can expect ~US$100,0000 to US$125,000 as their base salary. Using an USD-RMB exchange rate of 1.0 to 6.4, that’s about ¥640,000 to ¥800,000. In addition to the base salary, the firms also pay year-end bonus, which can be another US$100,000 (¥640,000). In total, a first-year analyst can earn over ¥1 million. Same story for investment banking associates.

By contrast, the Chinese investment banks have “domestic pay”. This pay is significantly lower than that of the global investment banks. That’s because domestically, the Chinese cost of living is much lower. Leadership of the Chinese banks also have to be mindful of the political and social implications. Therefore, the compensation package from the local Chinese investment banks are usually far lower. A first-year investment banking analyst may earn less than ¥500,000. In USD terms, that’s less than US$80,000. Among the domestic banks, CICC and CITIC probably pay the highest.

Hong Kong vs. Mainland

Historically, the global investment banks covered Chinese clients from the Hong Kong office. Some also have an IBD office in Beijing through a joint venture. For example, Goldman Sachs was in a joint venture with Gaohua Securities. The joint venture was known as Goldman Sachs Gaohua (高盛高华) in which Goldman Sachs only owned 51% of the Beijing operations. However, in 2021, the Chinese government granted approval for the global investment banks to acquire full ownership of their Mainland operations. Goldman Sachs, for example, reached agreement to acquire the remaining 49% of Goldman Sachs Gaohua. In addition, the Chinese government is also making it easier for global investment banks to operate in the Mainland. As a result, the global investment banks are now expanding beyond Mainland. They relocated bankers from Hong Kong to Mainland and are increasing their investment banking teams in the Mainland.

By contrast, the Chinese investment banks have always had a sizable presence in both Mainland and Hong Kong.

The location distinction between Mainland and Hong Kong has important implications on compensation for investment banking in China. First, the pre-tax compensation package is generally higher in Hong Kong than that in Mainland. In other words, for the exact same role, the pay is higher in Hong Kong than it is in Mainland. That’s partially because Hong Kong has a much higher cost of living. Second, the personal income tax rate is much higher in Mainland (up to 45%) than it is in Hong Kong (up to 20%).

Breaking into the Industry

Similar to the situation in other investment banking markets, it is very competitive to break into investment banking in China. Statistically, recruiting is even more difficult than in the United States just because China has a much larger population.

To break into investment banking in China at a top firm, you should try to attend a feeder school. That’s the standard and the most common way to enter into the industry.

However, there’s a separate way to break into the industry. The culture in China is very connection-driven. A large part of a candidate’s success is based on who the candidate knows or who the candidate’s parents know. If you have strong connections, you have a huge leg up in the recruiting process. If you don’t have strong connections, the best way is to attend a feeder school.

Feeder Schools

There are three types of feeder schools to break into China investment banking. The first type of feeder are top schools in the United States, United Kingdom, and Canada. Highly ranked public universities, such as Harvard and Stanford, as well as public universities, such as the University of Michigan and UC Berkeley are very prestigious in China. The second type of feeder are top schools in the Mainland, specifically 985 and 211 universities. Among these universities, Tsinghua, Peking, Fudan and Shanghai Jiao Tong (清北复交) have an outsized representation. The third type of feeder are top schools in Hong Kong. They are the University of Hong Kong (HKU), Chinese University in Hong Kong (CUHK) and to a lesser extent, Hong Kong University of Science & Technology (HKUST).

Investment Banking Course

In addition to attending a feeder school or having the right connections, candidates also need to know financial analysis. Our courses are taught by Goldman Sachs investment banker. We designed our courses to prepare you for investment banking. We teach you how to conduct financial analysis like how it’s done on Wall Street.

Upon completion of the courses, you will receive our Global Financial & Investment Analyst (GFIA) certification. You can sign up here.

Investment Banking in Hong Kong

By Careers No Comments

Overview of Investment Banking in Hong Kong

Hong Kong has a very established and robust financial markets system. The banking sector serves as the backbone of Hong Kong’s financial markets system. This article will focus specifically on investment banking in Hong Kong. If you’re interested in the Hong Kong banking sector in general, please see our other article.

Similar to how things work in the United States and in Europe, investment banking in Hong Kong is centered primarily on M&A and financing. However, unlike the United States and Europe, the Hong Kong investment banking work is very financing-driven. There are certainly a lot of M&A mandates, but financing is currently the more important and lucrative business.

Hong Kong is also the regional headquarters of many of the world’s largest private equity firms and hedge funds. Private equity megafunds, such as Apollo, Bain, Blackstone, Carlyle and KKR all have presence in Hong Kong. Major hedge funds, such as Citadel, D.E. Shaw and Point 72 also have offices in the city. As a result, Hong Kong investment bankers can easily exit to private equity and hedge fund.

In terms of coverage, Hong Kong covers greater Asia Pacific. Most of the deals are China deals. However, bankers in Hong Kong also have a chance to work on Korean, Japanese, Southeast Asian, and cross-border transactions. While banks have offices in Seoul (Korea), Tokyo (Japan), Singapore and Mumbai (Southeast Asia), many transactions also involve HK staff. As a result, bankers in Hong Kong gain exposure to Mainland China deals and deals in the rest of Asia Pacific. That’s because many transactions often involve China in some ways. For example, the buyer might be from Mainland China while the target might be based in Pakistan. Another example could be that the debt financing is being marketed primarily to Chinese credit funds.

investment banking in Hong Kong
List of Top Investment Banks in Hong Kong

Broadly speaking, there are three types of investment banks in Hong Kong.

First, there are the global investment banks. These are usually the bulge bracket American and European investment banks. The American bugle brackets (i.e. Goldman Sachs, Morgan Stanley, J.P. Morgan) are the most prestigious in Hong Kong. Second, there are the native Chinese investment banks. These are domestic banks cultivated in Mainland China. And third, there are the British investment banks. British investment banks have an outsized influence in Hong Kong because they colonized Hong Kong until 1997.

Global Investment Banks

Even though the global investment banks have a waning market share in China, their China businesses are still growing. That’s because the Chinese financial markets and economy are growing. Consequently, the global banks are earning more profits from investment banking in China even though their market share is declining. In addition, these global corporations are still the most prestigious. Beyond reputation, they also pay the highest compensation.

  • Bank of America
  • Barclays
  • Citigroup
  • Credit Suisse
  • Deutsche Bank
  • Goldman Sachs
  • P. Morgan
  • Morgan Stanley
  • UBS

The above are the bulge brackets within global investment banks. These firms have a towering presence not only in M&A, but also in financing. However, the bulge brackets are not the only global investment banks in Hong Kong. Hong Kong also has the American “elite boutiques” among the global investment banks. Unlike their bulge bracket peers, these elite boutiques only specialize in M&A in Hong Kong. They have limited to no financing capabilities. Financing deals in Hong Kong are usually done either by the bulge brackets or by the Chinese investment banks. The elite boutiques have little to no role in these transactions. That’s because they lack the large balance sheet that the bulge bracket investment banks have. The following is a list of the top American M&A elite boutiques in Hong Kong.

  • Evercore
  • Lazard
  • Moelis
  • PJT Partners

While these elite boutiques are incredibly prestigious in the United States, they are marginalized in Hong Kong. Even in M&A advisory, which is their specialty, they are miles behind the bulge brackets and Chinese investment banks. In terms of prestige, these firms don’t command the same respect in Hong Kong as they do in New York. Hence, working at these firms’ Hong Kong office do not come with good exit opportunities

Chinese Investment Banks

The domestic Chinese investment banks significantly increased their capabilities over the past two decades. As of the time of writing this article, the Chinese investment banks have the dominant market share in Hong Kong. They have the most deal flow and are miles ahead of the global and British peers.

  • China International Capital Corporation (CICC) (中金)
  • China Securities (中国证券)
  • CITIC Securities (CITIC) (中信)
  • Guotai Junan Securities (GTJA) (国泰君安)
  • Haitong Securities (海通)
  • Huatai Securities (华泰)
  • Industrial and Commerce Bank of China (ICBC) (工商银行)

British Investment Banks

There are two British investment banks that have a notable presence in Hong Kong. They are HSBC and Standard Chartered. Barclays is also a British bank, but unlike HSBC and Standard Chartered, it has a very strong presence globally.  Hence, we categorize Barclays as a global investment bank. The “H” in HSBC stands for Hong Kong, which hints the importance of Hong Kong to HSBC. These two firms are very strong in Hong Kong. Unlike their bulge bracket peers, these two banks do not have a dominant presence in other major markets. Hong Kong is really their main market. These two British banks don’t have the resources of their global peers nor the deal flow of their Chinese peers.

Salary for Investment Banking in Hong Kong 

In general, the Chinese investment banks pay less than the global and British investment banks. The global investment banks pay the highest. The American banks, such as Goldman Sachs, Morgan Stanley, J.P. Morgan, institute global pay for bankers in Hong Kong. That means they get paid the same as their peers in New York without cost of living adjustments. As a result, a fresh college graduate can expect to earn US$100,000 to US$125,000 in salary alone. But that’s just salary. There’s also bonus. All in, fresh college graduates can expect close to US$200,000 for the first year, which is about HK$1.6 million. That’s very high compared to Hong Kong’s median annual salary (50th percentile) of ~HK$240,000.

On the surface, Hong Kong bankers get paid the same as their New York peers. In reality, however, Hong Kong bankers get paid MORE than their New York peers. That’s because of two factors.

First, Hong Kong has a far lower personal income tax rate than the United States. Hong Kong’s highest personal income tax rate bracket is 17%. That means the effective tax rate that bankers pay is lower than 17%. In reality, it’s closer to the low to mid-teens. By contrast, the New York bankers have to pay federal taxes, state taxes, city taxes and FICA. This would amount to ~36% effective tax rate, more than double that of Hong Kong. In addition, American bankers have to pay sales taxes on most items they purchase. New York, for example, institutes ~9% sales tax on purchases. By contrast, Hong Kong does not have sales taxes. To make things even more imbalanced, the United States taxes investment profits while Hong Kong does not. Bankers invest in indexes and funds (not individual stocks), so investment profits is another stream of income.

Exit Opportunities

After working in investment banking in Hong Kong, people generally exit to three types of opportunities.

First, they exit to private equity. Hong Kong has a healthy mix of global megafunds (i.e. KKR), pan-Asia funds (i.e. PAG), and China-focused funds (i.e. FountainVest). Unlike the US, Hong Kong private equity likes to hire investment bankers with more experience for each level than less. Second, they exit to hedge funds. As one of the three leading international financial centers, Hong Kong is also full of hedge funds. Hedge funds in Hong Kong at the junior level pays a lot, but not as much as the US hedge funds. And lastly, a very common exit among Hong Kong investment bankers is into influential roles at corporate / startups. Many bankers take up corporate development roles and rise up the ranks to become senior members of corporations. These can be highly lucrative and are very influential in Hong Kong because Hong Kong is a very tight-knit city.

Breaking into Investment Banking in Hong Kong

There’re three ways to break into the industry.

The first way is to enter the industry at the analyst level (from college or non-MBA master’s program). The analyst program is highly competitive and very rewarding. The best point of entry is through the Summer Analyst program. The banks will post the job applications on their website every year, but they’ll prioritize candidates from target schools. More so than the US, many analyst-level hires are relationship hires. Hong Kong is notorious for hiring analysts because of the candidates’ familial business or political background. More so than the United States and Europe, China is very much a connection-driven (guanxi) country. Who you know is often way more important than what you know.

The second way is to enter the industry at the associate level. The Hong Kong office of global banks recruit Summer Associates from the top US MBA programs. Top European MBA programs are not at the same level for investment banking in Hong Kong. INSEAD, HEC, Judge, and others lack significant luster when compared to the top US MBA programs. Same thing goes for the Chinese MBA programs. CEIBS has been making significant leeway in the MBA rankings. However, it doesn’t come anywhere close to the American MBA programs in terms of IBD Summer Associate placements. Consequently, at the associate level, the best way to break in is through top US MBA programs.

The third way is to enter the industry as an experienced professional. This is oftentimes based on influence, relationships, and background instead of knowledge of finance. You can transition into investment banking senior-level roles if you have the right business and Mainland political relationships. Happens all the time in professional services (i.e. law, private equity, consulting), not just in investment banking in Hong Kong.

Target Schools

There are three types of target schools to break into China investment banking. The first type of feeder are top schools in the United States, United Kingdom, and Canada. Please note that it’s only the United States, United Kingdom and Canada. Schools from the rest of Europe or Australia don’t have comparable placements. Overseas schools, such as Harvard and Cambridge, are the most represented in Hong Kong investment banking. The second feeder are top schools in Hong Kong. They are the University of Hong Kong (HKU), Chinese University in Hong Kong (CUHK) and to a lesser extent, Hong Kong University of Science & Technology (HKUST). The third type of feeder are top schools in the Mainland. Hong Kong offices recruit very selectively from Mainland universities. Specifically, the Hong Kong office recruits from Tsinghua, Peking, Fudan and Shanghai Jiao Tong.

Attending top schools in the US and UK is the best way to break into investment banking in Hong Kong. If that’s not feasible, then try to go to HKU. HKU doesn’t have as much of a campus feel as CUHK, but it is stronger in placement. CUHK and HKUST are other good options after HKU. Other Hong Kong universities, such as Baptist, Polytech, CityU, and Lingnan don’t come anywhere close.

Language Requirements

Historically, many of Hong Kong’s top bankers are Caucasian expats from the United States and Europe. That’s no longer the case. The ability to speak Mandarin, fitting into the Mainland culture and having Chinese citizenship is becoming increasingly important. Banks have pushed out many senior bankers because they lack the language skills and cultural skills to succeed in China. You might be able to break into the industry if you speak fluent English and fluent Cantonese. That’s because you can cover many of the local Hong Kong corporations. However, the Hong Kong economy is minuscule compared to Mainland China. Mainland China speaks Mandarin, not Cantonese. Therefore, if you want to work beyond the local Hong Kong corporations, you must speak Mandarin. Mandarin fluency is extremely important to succeed in investment banking in Hong Kong.

Investment Banking Course

At Lumovest, we are intimately familiar with what it takes to break into investment banking in Hong Kong. We developed our courses to teach you the financial modeling and analytical skillset to land an investment banking offer. Hong Kong interviews, like that of New York and London, involve a mixture of behavioral and technical questions. In addition, many Hong Kong bankers are lacking in terms of financial modeling skills compared to peers in New York. If you can master the technicals and financial modeling, you can set yourself apart from competition. We’re regularly in touch with Hong Kong bankers in order to keep our courses up to date.

Our courses are taught by former Goldman Sachs banker. The curriculum teaches you how to do things like a professional investment banker. You’ll learn how to analyze companies professionally. At the end of the program, you’ll receive our certificate, which you can also add to your resume and LinkedIn. You can sign up here.

Investment Banking in India

By Careers No Comments

Background of Investment Banking in India

Banking services have long existed in India since the ancient times. By 1990, there were several thousand bankers in India.

In 1990, the country set up its own self-regulatory organization called the Association of Merchant Bankers of India (AMBI). In the early 2000s, the global investment banks expanded their operations into India. Recognizing the vast market potential of India, Goldman Sachs, Morgan Stanley, and others quickly built up their presence in the country. Subsequently, in 2010, AMBI changed its name to Association of Investment Bankers of India (AIBI). AIBI serves as the industry governing and self-regulatory body of the investment banking industry in India. All major investment banks are members of the AIBI.

Today, India is a high growth country with a vibrant financial market. All leading global investment banks have a regional presence in India. In addition, the country has successfully nurtured several of its own highly reputable domestic investment banks.

List of Investment Banks in India

Broadly speaking, there are two types of investment banks in India. First, there are the global investment banks. These are usually American and European investment banks with a regional presence in India, covering the Indian market. Second, there are the domestic Indian investment banks. These are local native banks founded in India. The global investment banks have greater scale, greater resources, and greater brand recognition than the native Indian investment banks. That’s because these global banks have presence around the world. However, the native Indian investment banks often have strong local relationships. They can win new mandates through their local connections and local know-how. Here’s a list of the top investment banks in India.

Global Investment Banks

Bank of America

Bank of America is an American multinational universal bank and financial services holding company headquartered in Charlotte, North Carolina. BofA Securities India Ltd is the subsidiary entity providing investment banking services for the Indian market. BofA Securities provides capital raising solutions, M&A advisory, securities research, and sales and trading capabilities.

Website (India): https://www.bofa-india.com/aboutus.html

Website: https://business.bofa.com/

Barclays

Barclays plc is a British multinational universal bank, headquartered in London, England. Founded more than 300 years ago in 1690, the company is listed on the New York Stock Exchange and the London Stock Exchange.

Website: https://home.barclays/

Citigroup

Citigroup is an American multinational universal bank, headquartered in New York City, New York. The investment banking services is provided through Citi’s Institutional Clients Group. Besides its investment banking services, Citi also offers retail banking services in India.

Website: https://icg.citi.com/icghome/what-we-do/bcma

Credit Suisse

Credit Suisse Group AG is a global investment bank and financial services firm founded and based in Switzerland. Founded in 1856, Credit Suisse also has a major focus on wealth management for the super wealthy. Credit Suisse established its presence in India in 1997. Today, the firm has offices in Mumbai, Pune and Gurgaon, with vendor offices in Bangalore, Hyderabad and Kolkata. India is the second-​largest footprint for Credit Suisse outside of Switzerland, which demonstrates the importance of the country.

Website: https://www.credit-suisse.com/

Credit Suisse Pune Office

Credit Suisse Pune Office

Deutsche Bank

Deutsche Bank AG is a German multinational investment bank and financial services company headquartered in Frankfurt, Germany. Founded in 1870, the company is dual-listed today on the Frankfurt Stock Exchange and the New York Stock Exchange. While DB doesn’t offer retail banking services in many other big countries, DB does offer it in India.

Website: https://www.db.com/

Goldman Sachs

Goldman Sachs is an American multinational investment bank and financial services company headquartered in New York City. It is arguably the most prestigious investment bank in the world. It offers services in investment management, securities, asset management, prime brokerage, and securities underwriting. Goldman Sachs opened its Bengaluru office in 2004, Mumbai office in 2006 and Hyderabad office in 2021.

Website: https://www.goldmansachs.com/

HSBC

HSBC, officially known as The Hongkong and Shanghai Banking Corporation Limited, is a British universal bank. It operates branches and offices throughout the Indo-Pacific region, and in other countries around the world.

Website: https://www.hsbc.com/

J.P. Morgan

JPMorgan Chase & Co. is an American multinational universal bank and financial services holding company headquartered in New York City. JPM entered into the India market in 1922. Today, it has offices across Bengaluru, Hyderabad, and Mumbai.

Website: https://www.jpmorgan.com/

Jefferies

Jefferies Group LLC is an American multinational independent investment bank and financial services company headquartered in New York City. The firm provides clients with capital markets and financial advisory services, institutional brokerage, securities research, and asset management. It was founded in 1962.

Website: https://jefferies.com/

Morgan Stanley

Morgan Stanley is an American multinational investment bank and financial services company headquartered in New York City. MS has been operating in India for over 26 years, providing a variety of services to domestic and international clients. It has five offices in India: four in Mumbai and one in Bengaluru.

Website: https://www.morganstanley.com/

Nomura

Nomura is a Japanese multinational universal bank with an integrated network spanning over 30 countries. Founded in 1925, it employs nearly 30,000 customers across the world. Nomura set up its Indian operations in Mumbai in 2005. Today, Nomura India employs staff across Investment Banking, Global Markets, and Corporate Infrastructure divisions.

Website: https://www.nomura.com/

UBS Investment Bank

UBS is a Swiss multinational investment bank founded and based in Switzerland. Co-headquartered in Zürich and Basel, UBS operates in all major financial centers around the world. UBS Securities India Private Limited is the company’s subsidiary entity providing investment banking services in India.

Website: https://www.ubs.com/

Indian Investment Banks

Many domestic Indian investment banks have very good deal flow in India. The following firms have the most deal flow according to data compiled on Indian M&A and financing transactions.

  • AK Capital Services
  • Avendus Capital
  • Axis Bank
  • Bajaj Capital
  • Derivium Capital
  • Edelweiss Financial Services Ltd
  • HDFC Bank
  • ICICI Bank
  • ICICI Securities Primary Dealership Limited:
  • Indusind Bank Ltd
  • JM Financial Ltd
  • Karvey Consultants Ltd
  • Kotak Mahindra Bank Ltd
  • LKP Securities
  • L&T Financial Services
  • Punjab National Bank (India)
  • RBSA Advisors
  • Real Growth Securities Pvt Ltd
  • SPA Capital Advisors Ltd
  • State Bank of India (SBI)
  • Tipsons Consultancy Services
  • Trust Group
  • Yes Bank

Services for the Indian Market

In the preceding section, we talked about the two types of investment banks in India. The global investment banks with a regional office in India and the domestic Indian banks specializing in India. There’s a pretty clear divergence in the type of services the two types of investment banks offer.

The global investment banks focus on (i) Mergers & Acquisitions (M&A) and (ii) Capital Markets (Financing). M&A refers to the buying and selling of companies. Capital Markets refers to raising capital from debt and equity investors. M&A and financing are the heart and soul of the global investment banks. These firms generate most of their investment banking revenue from M&A advisory fees and underwriting fees.

By contrast, the domestic Indian investment banks offer a wide range of investment banking services. Similar to the global banks, the domestic Indian investment banks also provide M&A and financing advisory services. However, in addition to these two core services, the native firms also offer a wide range of ancillary services.

Start-Up Advisory

Domestic banks can advise start-ups through early stage fundraising. Similarly, they can also help venture capital firms with finding attractive investment opportunities.

Partner Search / Joint Venture

As multinational corporations do in many places in Asia, they often form joint venture partnerships with local domestic companies. The domestic banks can advise them through this process and helping them find the right local partner.

Restructuring

After India passed the Insolvency and Bankruptcy Code, 2016 (IBC 2016), the country possesses a legal framework for restructuring and reorganization. The local domestic banks provide this service to work with creditors and debtors through the IBC 2016.

Due Diligence

Domestic banks can also conduct due diligence for their clients. This is not something that the global investment banks offer as a standalone service. The global banks will usually conduct due diligence as part of M&A or financing advisory. However, the domestic banks differentiate themselves by offering this service to clients in silo.

Investment Banking in India Salaries

Here are some of the salary information for an entry-level investment banking analyst position at the global investment banks. Please note that this is just the salary. Investment banking compensation includes a mixture of (i) salary, (ii) bonus, and on some rare occasions (iii) stock-based compensation. Therefore, total all-in compensation is likely higher than the figures below.

Investment Banking in India Salaries

GFIA Certification for Investment Banking in India

Because investment banking is a very high paying job, it’s very competitive. To successfully break into the industry, candidates should demonstrate (i) a track record of excellence and (ii) mastery of financial analysis.

You can demonstrate a track record of excellence through academics, extracurriculars and work experience. Academically, you can demonstrate this by attending some of the top universities such as University of Delhi and IIT. In addition, grades and test scores also matter. Extracurricular-wise, if you’ve won certain competitions in your hobbies, that would also add points. And work experience wise, you can strengthen your candidacy by working at big companies and through investment banking internships.

You can demonstrate mastery of financial analysis through our GFIA Certification program. We offer a full suite of financial analysis courses to prepare you for a career in investment banking. Upon successful completion of our program, you’ll receive our Global Financial & Investment Analyst (GFIA) certification. You can sign up here.

Is negative working capital bad?

By Investment Banking Interview Questions No Comments

The investment banking interview question we’re going to go over today is a tricky one: “Is negative working capital bad?” Here’s what you can say.

Interview Answer

“Negative working capital is not necessarily bad. It depends.  

For example, a lot of businesses have large deferred revenue balances because they receive cash upfront before they provide the product or service. This large deferred revenue balance causes working capital to go negative. For these businesses, negative working capital is actually a good thing.

For other businesses, they might have negative working capital, but as long as they sufficient cash in their bank account and access to revolver, they should be OK.

Where negative working capital becomes alarming is if the company doesn’t have sufficient cash on hand and it doesn’t have access to revolver. Then it could face a liquidity crisis.”

Additional Tip

That’s how you can answer this question: “Is negative working capital bad”. The most common mistake we see candidates make with this question is that they talk for several minutes and interviewer still has no idea what their stance is. So make your stance clear right from the beginning.

More IBD Interview Questions

Tell me about a recent M&A deal that you followed.

Walk me through the different acquisition currencies in an M&A deal.

What are the different types of debt and how are they different?

JP Morgan HireVue Questions

By Careers No Comments

How HireVue Works

The JP Morgan HireVue interview is a critical component of the bank’s recruiting process. After you submit your JPM application and complete Pymetrics, the firm will ask you to complete its HireVue interview. The interview will ask you a series of questions, usually behavioral in nature. For each question, you have to record a video of yourself on the spot answering the question. Therefore, make sure your computer has a functioning camera and microphone. In the beginning of the JP Morgan HireVue, the system will automatically test your camera and microphone. It will only allow you to start the assessment if both are working.

JP Morgan HireVue Invitation

The questions are set by JPM, not by HireVue. It will show you one question at a time. This means that you don’t get to see all the questions at once. You only get to see the second question after you submit your video recording for the first question. Each question comes with one retry. However, once you finish a question, you do not get to go back and edit it. Once the system shows you the question, it’ll give you some time to prepare your answer. Then the system will prompt your camera and microphone to start recording. When you see that the recording has began, you should deliver your answer.

Similar to an exam, the JP Morgan HireVue interview has a time limit. We’ll tell you JPM’s time limits for each question later in this article.

JP Morgan HireVue Questions and Answers

OK, so now we understand how HireVue works. In this next section, we’ll go through the real JP Morgan HireVue questions for the 2022 Investment Banking Summer Analysts. We’ll look at the exact questions, provide our analysis on the approach, and show you illustrative answers.

For past Investment Banking Summer Analyst HireVue, the system asked candidates 3 questions. Candidates had to record a video response to each question. Each question comes with its own specified preparation time and recording time. You don’t have to use all of the allotted time. There isn’t a single “right” answer to each question per se. The “right” answers are ones that are clearly delivered and highlight your positive characteristics.

If you have a technical issue or disruption, don’t worry – you’ll have another chance to record your response. However, your second response will be automatically submitted and you’ll progress to the next question.

When you work on the HireVue questions, do not reference any confidential information. This should go without saying, but JPM HireVue is a bit more stringent on the definition of “confidential information”. For example, if you cite past work experiences, do not include the client name in your answers.

Please remember that these are questions from a previous interview process. There’s no guarantee that JPM will use the same questions or assign the same time limit for future interviews.

JP Morgan HireVue Question #1

HireVue Question: Discuss a major world event and how it could affect financial markets.

Lumovest Analysis: This question tests your knowledge of current events and your ability to think critically about their implications. But here’s the tricky part: not all world events are equal. Picking the wrong event can completely ruin your answer. You have to pick ones that have clear and material impact on the financial markets.

To find these events, use three websites: Bloomberg, Reuters, and the Wall Street Journal. These three websites are all you need. Too many websites can be counterproductive. You don’t even have to read the full stories every day. Just read the headlines. You can read the full story and do more research only on ones that you find most interesting. Don’t dwell on describing the event. Instead, briefly describe the event. Then, spend most of your time discussing your views on how it will affect financial markets.

The JPM HireVue system gives you 30 seconds to prepare and gather your thoughts. This answer has a 2-minute limit. Hence, you should plan your answer to last between 90 seconds to 110 seconds.

Sample Answer

A major world event is the ongoing conflict between the United States and China. The conflict between the two major economies started with trade imbalance. However, it quickly expanded to human rights, military arms race, technology export controls, and investment restrictions. This has significant impact on the global financial markets.

First, the two countries imposed tariffs on goods from each other. Additionally, the two countries also made it more difficult for the other country’s companies to operate in one another’s territories. This increased many companies’ cost, dented their growth and decreased their profitability. The S&P 500 index in the US and the Hang Seng Index in Asia both declined due to the trade war.

Second, the US passed laws requiring funds to divest certain Chinese investments. On the public side of financial markets, major funds divested various Chinese stocks. On the private side of financial markets, CFIUS (Committee on Foreign Investment in the United States) blocked many Chinese transactions.

And third, the US passed laws requiring Chinese companies trading on the American stock exchanges to submit audit documents. The US stock exchanges will delist companies that fail to do so for three years. However, Chinese laws forbid Chinese companies from sharing audit documents with other countries. As a result, there’s significant delisting risk hanging over Chinese companies trading on the US stock exchanges. Due to this risk, the stocks of major Chinese companies such as Alibaba and Didi declined by nearly 60%.

So to sum up, the ongoing conflict between the United States and China roils the global financial markets. The higher tariffs and more stringent investment restrictions dented confidence and discouraged investors, triggering widespread declines in Chinese stocks.

JP Morgan HireVue Question #2:

HireVue Question: Provide an example of a project where you sought out relevant information and used it to develop a plan of action. Describe the situation, the actions you took, and the outcome.

Lumovest Analysis: The key is in the second sentence of the question. It tells you exactly how to structure your answer. Notice that it tells you to structure your answer in three parts. First, you need to describe the situation where you gathered information to develop a plan of action. Second, you need to describe your actions. And third, you need to describe the outcome. This is very much in-line with the STAR framework: Situation, Task, Action, Results. You can pick a project from academics, extracurricular or professional work experience. We recommend using this answer to demonstrate that you are someone who is proactive and thoughtful.

The JPM HireVue system gives you 30 seconds to prepare and gather your thoughts. This answer has a 2-minute limit. Hence, you should plan your answer to last between 90 seconds to 110 seconds.

Sample Answer

In school, I was part of the Environmental Protection Club. During my junior year, the club elected me as the Internal Vice President. In this capacity, I was responsible for recruiting new members. However, our club faced a big problem. We haven’t been able to recruit a single new member for the Spring semester over the last 4 years. My task was to solve this problem.

Unfortunately, this isn’t a problem where information is readily available, so I had to be creative. I looked through past event registration records to identify students who came to our recruiting events in the previous years. Since none of them ultimately joined, they were the perfect audience for me to speak with. I searched them on Instagram and Facebook to see if we have any mutual friends. Then, I invited them out individually so I can ask them why they didn’t join. I wanted to speak to each of them alone because I didn’t want one person’s answers to affect that of others. After 8 such surveys, a pattern began to emerge. Despite meeting me separately, all of them identified our club’s reputation as the main reason for not joining. Turns out, we have a reputation as a club that hosts many events and consumes significant time.

When the January semester started, I altered our club’s advertisements to specifically address the estimated time commitment. In our info sessions, I repeatedly emphasized that the time commitment is flexible. New members are free to choose to attend environmental protection events based on their availabilities. This alleviated many prospective members’ concerns. At the end, our club was able to recruit 15 new members in the January semester. It was one of my proudest contributions to the club.

JP Morgan HireVue Question #3:

HireVue Question: Describe a situation in which you learned something significant from a mistake you made at work or in a school project.

Lumovest Analysis: Here’s the secret sauce to get this question right. Talk about an honest mistake. Don’t try to be sneaky and turn that mistake into a strength. There’s a lot of interview advice online about twisting mistakes into contributions and weaknesses into strengths. That will come across as insincere. The truth is, everybody makes mistakes. Who are the interviewers to reject you because you made a mistake? They’re not perfect themselves. As a result, they are not going to reject you because you made a mistake. Therefore, be confident and open up your vulnerabilities and talk about a real mistake. It’ll come across as sincere and refreshing.

We recommend structuring your answer in the following manner. First, set up the context. Then, describe what you did. Third, show why that is a mistake. And lastly, explain what you learned.

Similar to the other questions, the JPM HireVue system gives you 30 seconds to prepare and gather your thoughts. This answer has a 2-minute limit. Consequently, you should plan your answer to last between 90 seconds to 110 seconds.

Sample Answer

In school, our engineering department required us to take a web development class. It grades students based solely on exam scores. Personally, I was passionate about software engineering since when I was 6. Over the years, I had already learned a lot about web development. Therefore, I was very confident in myself. Perhaps more accurately, I was arrogant.

I felt I was too good to be in that class. As a result, I skipped the lectures on a regular basis. For most of the semester, I didn’t even read the textbooks or lecture notes. I performed very well on the final exam and finished the class with a perfect A.

However, this turned out to be a grave mistake. While my arrogance didn’t affect my grades, it did ruin my reputation. Because of my actions in that class, my classmates thought I didn’t care about grades. They perceived me as someone who isn’t serious about his academic studies. The fascinating part about reputation is that it develops based on what people see and what people hear. I don’t really get a chance to explain myself or refute the perceptions. It just develops and sticks. This reputation followed me the entire year and significantly affected my life. For example, classmates didn’t want me in their group project for other classes because they thought I wouldn’t contribute.

From this mistake, I learned two important lessons. First, I learned not to be arrogant. Arrogance can be very harmful. It leads me to take actions that are detrimental in the long-term to feed a positive feeling in the short-term. And second, I learned the importance of reputation. Reputation is so important and it’s shaped by perceptions. From that point onwards, I try to be thoughtful of how others will perceive my actions.

What About Technical Questions?

Unlike other banks’ HireVue questions, JP Morgan HireVue did ask technical questions. You may get one technical question for summer internships and full-time recruiting. For students, the HireVue questions are mostly behavioral in nature. However, technicals may come up. They did come up in the past. We’ve seen some examples of these technical questions. The good news is that they’re very rudimentary. For example, they might ask you what the financial statements are or to explain Beta. They are not hard at all. So the takeaway here is that technical questions don’t usually show up in JP Morgan HireVue. Even when technical questions do appear in JPM’s HireVue, they’re super easy.

Preparing for the Next Round after HireVue

By contrast, technical questions for in-person interviews are a completely different story. They can be very difficult and challenging. We recommend developing a strong foundation in accounting, valuation (Enterprise Value / Equity Value, DCF, multiples), M&A, and LBO.

Here at Lumovest, we specialize in teaching technicals. Our curriculum is designed for candidates who want to work at a top bank, such as J.P. Morgan. It covers everything you need to learn for your interviews and will help you develop advanced financial modeling skills. You’ll learn directly from a former Goldman Sachs investment banker who sat on the campus recruiting team. At the end, you’ll receive our official blockchain-verified certificate.

You can sign up here.

Related Readings

JP Morgan Pymetrics

Goldman Sachs HireVue

Morgan Stanley HireVue

JP Morgan Pymetrics

By Careers No Comments

The Background

The JP Morgan Pymetrics assessment is a critical step in the job application process. When you apply for summer internships and full-time positions with JPM, the firm will ask you to complete the assessment. How you perform in this assessment will impact your application outcome. As is the case with HireVUE and in-person interviews, you can prepare in advance for Pymetrics.

How Pymetrics Works

So what is the concept behind Pymetrics? Historically, companies hire people based solely on interviews. But there are so many problems with interviews. Different people ask different interview questions. You can easily script “good” answers. Every candidate says they’re passionate about finance. Anyone can say they’re hardworking and attentive to details. How do you tell who is real?

JPM decided to remove human bias by introducing Pymetrics. For a while, Goldman Sachs also evaluated whether to adopt this in its hiring practice. The big idea is to form profiles of the ideal employees in different divisions. Existing employees will play the game themselves, which provides the firm a target profile. Then they ask candidates to play the games to identify those who match the target profile. In other words, the companies will compare your Pymetrics results with existing employees’ results.

Important Thing to Keep in Mind

Here’s a really important point to keep in mind. Pymetrics will use your game results for ANY applications for the next 330 days without replay. In other words, Pymetrics will use the results for every job application that you apply to that uses Pymetrics. You don’t get to play the game every time you apply to a different company. Instead, it’s a single attempt that Pymetrics will send to every company.

JP Morgan Pymetrics Game #1: Money Exchange I

In this game, the system and pairs you to play with another “participant”. It is unclear whether the other participant is actually human. Given that arranging the game with another human participant could create uncertainties (i.e. there’s no one else playing this particular game at the moment), we believe it is likely that the other participant is a computer player.

In the beginning, the game gives you $10. The other participant has $0. You have to transfer a certain amount of money ($0 to $10) to the other participant. The other participant receives triple the amount of however much you transfer. After receiving your money, the other participant will send money back to you. He can return some, all or none of the money you sent him. The game does not specify whether you would also receive triple the amount he sends to you. However much you receive from him is what you keep at the end of the game. The system then asks you to evaluate whether the other participant was fair in this transaction. It gives you a scale of 0 (most unfair) to 10 (most fair).

JP Morgan Pymetrics Game Money Exchange

All you do in this game is two things. First, you decide how much you send to the other participant. You literally just type in a number from $0 to $10. Second, you judge whether the other participant is fair. You just click a number on the scale of 0 to 10. That’s all!

This game measures the Trust trait. It tests whether you have a good sense of trust and skepticism to handle the different situations at work.

Pymetrics Tip: Don’t give the other player all your money. And don’t be so untrusting that you don’t give the other player any money.

JP Morgan Pymetrics Game #2: Money Exchange II

Similar to the Money Exchange I game, this game pairs you with another participant, which is likely a computer player. To start, the system gives you and the other participant $5 each. Then, the game will give an extra $5 to either you or the other participant. The system claims that this is decided “randomly”. Whether it is truly random is unknown. Chances are, you’ll receive that extra $5.

Let’s say you receive the $5. The game then asks you whether you want to send any money to the other participant. You can send money from $0 to $5 in $0.50 increments. However much money you send is however much he’ll receive. Additionally, the amount after this transfer is the final amount you will end the game with. At the end, the system asks you to evaluate whether the transaction was fair. It’s also a scale from 0 (most unfair) to 10 (most fair).

JP Morgan Pymetrics Game Money Exchange 2

All you do in this JP Morgan Pymetrics game is two things. First, you decide how much money to send to the other participant. Please bear in mind that unlike Money Exchange I, you do not get any money back this time. Second, you rate how fair the transaction is. That’s another point of difference. Money Exchange I game asks you to evaluate the fairness of the other participant. However, this game asks you to evaluate the fairness of the transaction.

This game measures the Altruism trait. The system is evaluating whether you are someone who is generous to others.

Pymetrics Tip: Don’t be stingy. This means that you should send some money. Generous doesn’t mean foolishly generous. This means don’t send all of your money.

JP Morgan Pymetrics Game #3: Balloons

In this game, the objective is to earn as much money as you can by pumping balloons. Every time you pump the balloon, the money in the balloon increases by $0.05. However, each balloon has an explosion point. When the number of pumps reaches that point, the balloon will explode and the money will disappear. Interestingly, you won’t know the number of pumps that will cause each balloon to explode. So the balloon can explode at any time. You can pump too many times and lose all the money in the balloon. You can also pump too few times and lose the chance to make more money. The system will show you 39 balloons. You can opt to collect the money in the balloon at any time.

JP Morgan Pymetrics Game Balloons

All you do in this game is to decide between (a) pump the balloon and (b) collect the money. You do that for 39 balloons. The Pymetrics system forces you to decide whether to take additional risk for additional reward.

This game measures the Risk trait. It evaluates how you approach situations involving risk. Do you apply a consistent approach or do you adapt?

Pymetrics Tip: Pay attention to the balloon colors in the first couple of balloons to see if there is any pattern. There are three balloon colors: blue, orange, and yellow.

JP Morgan Pymetrics Game #4: Keypresses

In this game, the screen shows you a countdown timer. It’ll ask you whether you’re left-handed or right-handed. When the message “GO!” appears, press the space bar as quickly as you can with your dominant hand. Stop when the game tells you to stop. That’s all! To clarify, all you do in this game is to repeatedly press the space bar. There’s nothing else you have to do for this game.

JP Morgan Pymetrics Keypress Game

This game measures the Processing trait. It tests whether you can process things rapidly.

Pymetrics Tip: This is probably the most straightforward game in the Pymetrics assessment. Just hit that space bars fast. You’ll get a result that you are “lightning quick, and process things rapidly!”

JP Morgan Pymetrics Game #5: Digits

In this game, a sequence of digits from 0 to 9 will appear randomly one at a time. You have to remember each number the game shows to you. At the end, you have to input the correct sequence of numbers. For example, the first number that’ll appear on the screen may be 2. It’ll quickly disappear. Then 5 will appear. After that, 3. Then 7. And at the end, you have to remember that the number is 2537.

The game will increase the length of the sequence by one digit for each sequence you get right. So if you got the 4-digit sequence correct, the next round will be a 5-digit sequence. Similarly, the game will decrease the length of the sequence by one digit for each sequence you get wrong. If you get the 5-digit sequence wrong, the next round will be a 4-digit sequence. The game ends when you get 3 rounds wrong.

JP Morgan Pymetrics Memorize Numbers Game

Your job in this game is to memorize the numbers and input them correctly at the end of each round. This is one of the more mentally exhausting games in the Pymetrics assessment. Most importantly, the instruction says “do not write your answers down while playing”. With no way to enforce this, it is unknown what percentage of candidates comply with this. We believe this is a major flaw in the system that compromises the integrity of the assessment.

This game measures the Memory trait. It is testing how good you are at remembering things. Memory is such an essential skill in professional services.

Pymetrics Tip: Don’t cheat. Practice and exercise your memory skills so that you can memorize at least 8 digits.

JP Morgan Pymetrics Game #6: Easy or Hard

In this game, you have to hit the space bar button repeatedly. The game consists of x rounds. In each round, you have to decide whether to complete an easy task and a hard task. For the easy task, you have 3 seconds to press the spacebar 5 times. Upon successful completion, you may earn $1. For the hard task, you have 12 seconds to hit the spacebar 60 times. Upon successful completion, you may earn between $1.24 and $4.30.

Notice the emphasis on “may”. It is not certain that you will earn the money. There’s a chance that you don’t earn anything even if you complete the task. In each round, the system will show you the probability of earning the money if you complete the task. You have five seconds to choose. After five seconds, the system will choose one for you. You have 2 minutes to earn as much money as you can.

JP Morgan Pymetrics Easy or Hard Game

Your job in this game is to strategically choose whether to perform the easy task or the hard task. Then, hit the spacebar as quickly as you can to complete the task.

This game measures the Effort trait. It is not only testing whether you are a hardworking person. It is also testing whether you are strategic about how you spend your effort.

Pymetrics Tip: Before you play this game, try pressing the space bar. Can you press it 60 times in 12 seconds? If you can, you should definitely go for the hard tasks when the probability of payout is high.

JP Morgan Pymetrics Game #7: Stop 1

In this game, the game will show you either a green circle or a red circle. “Show” is an understatement to be honest. Flash is more precise. The game will flash to you green and red circles. Each circle appears on the screen for a fraction of a second. You have to press the spacebar when you see a red circle. Don’t do anything when you see a green circle. You have to respond as quickly and as accurately as you can.

JP Morgan Pymetrics Easy or Hard Game

This is another mentally exhausting game. Fortunately, the game only lasts 2 minutes. During this time, it will show you 80 circles.

This game measures the Attention trait. Pymetrics is assessing whether you can focus on tasks and still detect new information.

Pymetrics Tip: This is actually a very common game. You can get better at it by practicing on Lumosity.

JP Morgan Pymetrics Game #8: Arrows

This game challenges your concentration with a series of flashing arrows. In this game, the system flashes you different sets of arrows. If the arrows are blue or black, press the arrow button that correspond to the direction of the middle arrow. If the arrows are red, press the arrow button that correspond to the direction of the side arrows. Importantly, note that all arrows that are not the middle arrow are side arrows. All side arrows point to the same direction. So you will not have a situation where the arrows to the left of the middle arrow point up while the arrows to the right point down.

JP Morgan Pymetrics Arrows Game

This is one of the most mentally exhausting games in the JP Morgan Pymetrics assessment. It’ll show you 135 arrows in the span of 3 minutes. You have to respond as quickly and accurately as possible.

This game measures the Learning trait. It tests whether you can learn from your mistakes and adjust accordingly. To be honest, the connection between the game and candidates’ ability to learn is not obvious to us. However, since Pymetrics specializes in this domain, we believe it has its reasons.

Pymetrics Tip: This is actually a very common game. You can get better at it by practicing on Lumosity.

JP Morgan Pymetrics Game #9: Cards

In this game, you start with a $2,000 loan and you have a choice of four decks of cards. You can choose to draw cards from any deck. Some cards will earn you money. But other cards will lose you money. It is unclear which cards will earn you money and which ones will lose you money. You are free to switch from one deck to another at any time. You can switch as frequently as you wish. Continue drawing cards until the game is over. You get to draw 80 cards.

JP Morgan Pymetrics Cards Game

At the end of the game, Pymetrics will show you how much money you earned and how much you list. Keep in mind that you started off with $2,000 from a loan. Try not to fall below $2,000.

This game measures the Risk trait. It is testing to see whether you can adjust your strategy optimally in risky situations.

Pymetrics Tip: Luckily, it’s not entirely random. There is a hidden win-and-lose pattern. As you draw on the card, stay attentive and keep track of the cards drawn from each deck.

JP Morgan Pymetrics Game #10: Lengths

In this game, you will see two faces. One face has a small smile. One face has a big smile. The difference between the two is in the length of the smile. That difference between the lengths of the small smile and the big smile is a fraction of a centimeter. It will appear to many candidates as if these two smiles are the same. However, they are not. They are different by a fraction of a centimeter. It is literally testing your ability to detect a minuscule difference between two very similar lengths.

JP Morgan Pymetrics Smile Game

The game will flash you 90 smiles. Each smile will appear on the screen for less than a second. Therefore, you don’t really have time to measure anything. If it has a little smile, press the left arrow button. By contrast, if it has a big smile, press the right arrow button. The system may reward you with money for each one you get right.

This game measures the Learning trait. Frankly, we would’ve thought this measures the Attention to Details trait. But then again, we specialize in teaching finance rather than talent assessment.

Pymetrics Tip: This game is hard to practice. Either the size difference is immediately intuitive to you or it’s not.

JP Morgan Pymetrics Game #11: Towers

In this game, there are two sets of towers. Each set consists of three towers. Each tower consists of blocks in different colors. The set of towers at the top is how you need to remake the bottom set of towers. Your objective is to reorganize the bottom set of towers to match the top set of towers using the least number of moves. You have 2 minutes. At any time, you can undo a move or clear all and return to the beginning. Fortunately, this is not a mentally exhausting game. It’s pretty easy once you get the handle of it.

JP Morgan Pymetrics Towers Game

This game measures the Planning trait. It evaluates whether you’re someone who makes a plan before taking action.

Pymetrics Tip: This is just a regular Tower of Hanoi game. Tower of Hanoi is a common mathematical puzzle. Search on Google and YouTube to learn how to tackle this puzzle.

JP Morgan Pymetrics Game #12: Faces

In this game, the system will show you photographs of people with different facial expressions. Some photographs will come alone while others will have accompanying short stories providing situational context. Your task is to choose the word among 10 options that you believe best describes how the person is feeling. The 10 options are anger, determination, disgust, fear, happiness, hope, pain, sadness, surprise, and puzzlement.

JP Morgan Pymetrics Facial Expression Game

All you do in this game is to look at people’s photographs, read the story, and choose the right word. You have 7 seconds to pick your answer.

This game measures the Emotion trait. It assesses your ability to understand and relate to other people’s feelings.

The Assessment Results

At the end of each game, Pymetrics will tell you a bit about your personality. For example, it might say “You have great memory” or “You are very generous”. However, it doesn’t show you a “score” nor how you compare against others.

Once you complete the games, Pymetrics will show your results based on 9 traits. These 9 traits are Effort, Risk, Fairness, Emotion, Decision Making, Focus, Learning, Attention and Generosity. Pymetrics will give you short descriptions of your personality based on these 9 different traits. However, it will not share with you how you compare versus the employers’ employees or target profile.

Next Step: JP Morgan HireVUE

Once you complete the JP Morgan Pymetrics assessment, the next step is to complete the bank’s HireVUE. Lumovest has an article that tells you the past HireVUE questions as well as how to answer them. Once you pass HireVUE, you will receive an interview.

Learn Finance for JP Morgan Interviews

Lumovest is the finest institution in the world to learn financial and investment analysis. We teach you how to analyze financials and investments from the grounds up. Our curriculum is based on how things are done at the top banks and the top investment firms. Our lessons are interactive and visually intuitive. As a result, our courses are very practical and very relevant to what you’ll do on a day-to-day basis. The courses are taught by former Goldman Sachs investment banker.

Developing a strong financial analytical skillset will help you stand out during the JP Morgan hiring process. Through our courses, you’ll learn accounting, financial modeling, LBO, DCF, M&A and valuation. At the end, you’ll receive an official blockchain-verified digital certification, which you can showcase on your resume. You can sign up here.

Related Readings

Language Proficiency Levels

By Careers No Comments

Language Skills

Language proficiency levels can add significant value to your candidacy when you apply to jobs. This is especially the case for candidates pursuing a career in finance. In this article, we’ll learn what the different proficiency levels are and how to showcase your linguistic skills on your resume.

How to Write Language Proficiency Levels on Resume

In general, we recommend indicating your language proficiency level on your resume through a summary and supported by an official grade.

Think of a summary as a colloquial way to explain to anyone on the street your level of language proficiency. If someone asks you whether you’re fluent in a certain language (i.e. German), what would you say? You might say “I’m a native speaker” or “I’m a beginner”. Candidates should summarize language proficiency using the following levels:

  1. Native: You’re a native speaker if this is your mother tongue and you can speak it as well as residents of countries that have the language as the official tongue.
  2. Fluent: You’re fluent if you can use the language to converse smoothly without struggles.
  3. Intermediate: You’re intermediate if you can use the language to converse but may struggle with certain expressions or using certain vocabularies.
  4. Beginner: You’re a beginner if you just started learning the language.

On the other hand, a grade is a more official and formal way to indicate your level of language proficiency. Different jurisdictions have official grades for different levels of proficiency for their respective languages. For example, United States has an official grade for English proficiency levels from 0 (no English) to 5 (native English).

Taken together, on the resume, you should write your language proficiency level indicating whether you’re Native, Fluent, Intermediate or Beginner and, for all levels other than Native, supported by your official grade if you’ve taken the official language assessment test. For example, a job candidate may write the following on your resume: English (Native), Chinese (Intermediate; HSK 4). You shouldn’t write a grade level for native languages because in theory, native speakers wouldn’t take a language assessment test for their own mother tongue.

Language Proficiency Level on Resume CV

English Language Proficiency Levels

Interagency Language Roundtable (ILR) is the official United States government standard for English language proficiency. It has six main grade levels on its proficiency scale.

  • 0: No Proficiency / Limited Proficiency
  • 1: Elementary Proficiency
  • 2: Limited Working Proficiency
  • 3: Professional Working Proficiency
  • 4: Full Professional Proficiency
  • 5: Native Speaker

That being said, if you’re applying for jobs in the United States, it is not customary to include English proficiency level on your resume. In fact, successful candidates in the US generally won’t even have to write their English proficiency level on the resume because the interview is in English and so interviewers can evaluate your language proficiency directly. We’ll repeat because this is important. It’s not customary to include English proficiency level on your resume when applying for jobs in the US.

However, if you’re in another country where the official language is not English, it would make a lot of sense to indicate your English proficiency level on your resume.

Chinese Language Proficiency Levels

HSK, or Hanyu Shuiping Kaoshi, is a popular standardized test for non-native Chinese speakers. It assesses Mandarin Chinese proficiency in reading, writing, and listening. For job seekers and students, HSK certification can open doors to opportunities in China and beyond. Many Chinese universities and companies require a minimum HSK level for admission or employment.

HSK consists of six levels: HSK 1, HSK 2, HSK 3, HSK 4, HSK 5, and HSK 6. Each level builds on the previous one, reflecting increased language skills.

  • HSK 1 represents beginner proficiency, where you can understand basic phrases and communicate simple needs. This level covers 150 essential vocabulary words.
  • HSK 2 takes you to an elementary level, with the ability to handle daily conversations. You’ll need to learn 300 words to achieve this level.
  • HSK 3 marks an intermediate threshold, where you can discuss various topics and express yourself with more confidence. This level requires knowledge of 600 words.
  • HSK 4 shows an upper-intermediate level, allowing you to discuss complex matters and understand Chinese texts. You’ll need to master 1,200 words to reach this level.
  • HSK 5, the advanced level, signifies fluency in Mandarin, both written and spoken. Achieving this level requires a vocabulary of 2,500 words.
  • HSK 6 is the highest level, demonstrating native-like proficiency and mastery of Chinese. You’ll need to know over 5,000 words to attain this level.

European Language Proficiency Levels

European languages, such as French, Italian, German, Spanish and Greek, measure language proficiency using a grade metric known as “CEFR” or Common European Framework of Reference. CEFR has six levels.

  • A1 is the beginner level and indicates basic understanding of simple phrases.
  • A2 is the elementary level and allows for short conversations and routine matters.
  • B1 is the intermediate level and enables learners to handle travel situations and express opinions.
  • B2 is the upper-intermediate level and helps learners engage in complex discussions on various topics.
  • C1 is the advanced level and signifies fluency in the language and the ability to understand implicit meanings.
  • C2 is the mastery level and demonstrates native-like proficiency and effortless communication.

Learn More

At Lumovest, we’re building the place where anyone can learn finance and investing in an affordable and easy-to-understand manner. Our courses are far more intuitive, visualized, logical and colloquial than your college professor-taught courses. Our courses are taught by Goldman Sachs investment banker who has worked on transactions worth over $50 billion. We designed our courses to prepare you to succeed in the world of high finance. You’ll learn how to conduct financial analysis exactly like how it’s done on Wall Street’s top firms. Upon completion of the courses, you will receive our Global Financial & Investment Analyst (GFIA) certification. You can sign up here.

Levered Free Cash Flow

By Valuation No Comments

What is Levered Free Cash Flow?

Conceptually, Levered Free Cash Flow (LFCF) is the cash flow generated in a period that is free to be given to shareholders.

It’s the amount of cash flow leftover after paying for all expenses (including interest) and investing activities. All the mandatory and necessary cash payments to keep the business running have been paid for. All expenses and relevant investing-related cash outflows have been deducted. LFCF is what’s left that the company can use to fund financing activities. It can use the cash to pay shareholders dividends, repurchase shares, repay debt outstanding, or keep it in the bank.

Long-Term Assets

By Accounting No Comments

What are Long-Term Assets?

Long-Term Assets are assets that the company doesn’t intend or is unable to convert into cash within one year. This stands in contrast versus Current Assets which the company can convert into cash within one year.

The one year cutoff is usually the standard definition for Long-Term Assets. That’s because most companies have an operating cycle shorter than a year. However, for companies whose operating cycle is longer than one year, any Asset that the company doesn’t intend or is unable to convert into cash within the operating cycle should be classified as a Long-Term Asset. An operating cycle is the average period of time it takes for the company to produce the goods, sell them, and receive cash from customers. Any asset that isn’t a Current Asset must be a Long-Term Asset. For this reason, Long-Term Assets are also known as “Non-Current Assets”. We will use these two terms interchangeably.

Generally speaking, most companies have an operating cycle shorter than a year. Therefore, most companies use one year as the threshold for Current vs. Non-Current Assets.

Companies disclose all the Long-Term Assets they own and their values on the Balance Sheet. The one year period criteria is measured as 12 months from the date of the Balance Sheet.

Long-Term Assets List

Below is a list of Non-Current Assets that frequently appear on corporate Balance Sheets.

  • Long-Term Investments: Stocks, bonds and other securities the company intend to hold for more than one year. Companies may also own equity in private companies that would require an extended sale process to liquidate into cash.
  • Property, Plant & Equipment (PP&E): Land, buildings, buildings, machinery, equipment, furniture & fixtures, etc. Essentially, PP&E captures all the physical assets the company owns aside from inventory.
  • Identifiable Intangible Assets: Patents, copyright, trademark, brand identity & logo, trade secret, customer relationships, etc.
  • Goodwill: Unidentifiable intangible assets. Goodwill arises from buying another company at a price above the acquired company’s net asset value.
  • Other Long-Term Assets: No uniform standard here and varies from company to company.

It’s important to note that not all companies will have all the above assets. Some might own other Non-Current Assets, in addition to the above. Others might own less. It varies from company to company.

Long-Term Assets Example

Here’s a real example of Long-Term Assets from Nordstrom’s Balance Sheet. We highlighted them with the red box. You can find Nordstrom’s Balance Sheet on page 37 of its annual report here.

Long Term Assets Image

Notice that whereas Current Assets is explicitly labeled and has its own subtotal, Non-Current Assets aren’t specifically labeled as such. Instead, companies just list Non-Current Assets underneath the Current Assets section. The Balance Sheet implies that any asset outside of the Current Assets section must be a Long-Term Asset. This is usually the case for most public companies’ Balance Sheets.

Fixed Assets

Long-Term Assets are often confused with Fixed Assets. Long-Term Assets refer to assets that the company doesn’t intend or is unable to convert into cash within one year. By contrast, Fixed Assets refer to tangible physical assets with a useful life longer than one year. Fixed Assets is also known as Property, Plant & Equipment, or PP&E. Fixed Assets is just one of several Long-Term Assets. So while Long-Term Assets include Fixed Assets, the two are not synonymous.

LT Assets Impact on Business Quality

Non-Current Assets such as PP&E and Intangible Assets form the backbone of every company. These assets, such as computers, office furniture & fixtures, trademarks, and patents, enable businesses to sell their products. Companies that have significant Long-Term Assets driven by PP&E or intangible assets are generally capital-intensive. That’s because it takes lots of capital to acquire or these assets. A PP&E of $100mm on the Balance Sheet means the company had spent $100mm or more to acquire it. This means the business needs to spend a lot of money in order to make sales and generate profits. All else equal, businesses that can generate the same earnings with less Long-Term Assets are superior. They are run more efficiently and can earn profits with less capital investments. Therefore, all else equal, investors prefer to invest in non-capital intensive businesses.

Relationship with Other Financial Statements

Income Statement and Cash Flow Statement impact Long-Term Assets. Some examples of how they’re connected are:

  • Purchases or Sales of Securities (Cash Flow Statement) can increase or decrease the value of Long-Term Investments.
  • Capital Expenditures (Cash Flow Statement) and Depreciation (Cash Flow Statement) drive PP&E.
  • Divestitures (Cash Flow Statement) and Gain / Loss on Sale of Asset (Income Statement) also affect PP&E.
  • Amortization (Cash Flow Statement) impacts the value of Intangible Assets on the Balance Sheet.
  • Acquisitions, Net of Cash Acquired (Cash Flow Statement) can increase PP&E, Intangible Assets and Goodwill.

Long-Term Liabilities

By Accounting No Comments

What are Long-Term Liabilities?

Long-Term Liabilities are obligations that do not require cash payments within 12 months from the date of the Balance Sheet. This stands in contrast versus Short-Term Liabilities, which the company has to settle with cash payment within one year. Any liability that isn’t a Short-Term Liability must be a Long-Term Liability. Because Long-Term Liabilities are not due in the near future, this item is also known as “Non-Current Liabilities”. We will use these two terms interchangeably in this article.

The one year cutoff is usually the standard definition for Long-Term Liabilities (Non-Current Liabilities). That’s because most companies have an operating cycle shorter than one year. However, the classification is slightly different for companies whose operating cycles are longer than one year. An operating cycle is the average period of time it takes for the company to produce the goods, sell them, and receive cash from customers. For companies with operating cycles longer than a year, Long-Term Liabilities is defined as obligations due beyond the operating cycle. In general, most companies have an operating cycle shorter than a year. Therefore, most companies use the one year mark as the standard definition for Short-Term vs. Long-Term Liabilities.

Companies disclose all the Non-Current Liabilities they owe and their values on the Balance Sheet. The one year mark is measured as 12 months from the date of the Balance Sheet.

Long-Term Liabilities List

Below is a list of Long-Term Liabilities that commonly appear on a company’s Balance Sheets.

  • Long-Term Debt. These are debt the company borrows from lenders but don’t have to repay within one year. Public companies often don’t break out “Long-Term Debt” by tranches on the Balance Sheet.
  • Operating Lease. These are lease arrangements that last longer than one year. For example, a company may lease an office space or a machinery.
  • Deferred Revenue (Long-Term). These are payments the company received from customers for products and services the company won’t provide within one year.
  • Deferred Income Taxes (Long-Term). These are taxes that the company owes. However, the company does not expect to pay these taxes within one year. Instead it’ll pay these taxes in the future, beyond the one year mark.
  • Other Long-Term Liabilities. Companies may have miscellaneous obligations that they must report but are not large enough to have their own lines. Consequently, companies group them together into “Other Long-Term Liabilities”.

Not all companies will have all the liabilities we list above. Some companies might possess some obligations and not the rest. Others might owe other obligations in addition to the above. It varies from company to company.

Financial Liabilities vs. Operating Liabilities

There are two types of Long-Term Liabilities: financial liabilities and operating liabilities. Financial liabilities are obligations related to the capital structure. Debt is the most common financial liability that companies have. In addition, some companies may also have other financial liabilities. By contrast, operating liabilities are obligations related to the business operations. Examples of operating liabilities include operating leases, pension obligations, deferred revenue, and deferred income taxes.

Long-Term Liabilities Example

Here’s a real example of Non-Current Liabilities from Bight Horizons Family Solutions’ Balance Sheet. We emphasized them in yellow highlight. You can find Bright Horizons Family Solutions’ Balance Sheet on page 54 of its annual report here.

Long-Term Liabilities Example

Notice that Current Liabilities is explicitly labeled and has its own subtotal. On the contrary, Non-Current Liabilities are not explicitly labeled. There are no heading that inform readers that line items in a particular section are Non-Current Liabilities. Instead, companies merely list individual Long-Term Liabilities underneath the Current Liabilities section. The industry expects readers to know that any liabilities outside of the Current Liabilities section must be a Non-Current Liability. This is how most public companies usually present Long-Term Liabilities on the Balance Sheet.

Impact on Corporate Financial Health

Long-Term Liabilities are very common in business, especially among large corporations. Nearly all publicly-traded companies have Long-Term Liabilities of some sort. That’s because these obligations enable companies to reap immediate benefit now and pay later. For example, by borrowing debt that are due in 5-10 years, companies immediately receive the debt proceeds. They can use the proceeds to expand and grow their business. They don’t have to repay the debt until 5-10 years later.

While these obligations enable companies to accomplish their near-term objective, they do create long-term concerns. Companies eventually need to settle all liabilities with real payments. If the obligations accumulate into an overly large amount, companies risk potentially being unable to pay the obligations. This is especially the case if the future obligations are due within a short time span of one another. This could create a liquidity crisis where there’s not enough cash to pay all maturing obligations simultaneously.

Having some Non-Current Liabilities is a good thing. It allows management to optimize the company’s finances to grow faster and deliver greater returns to the shareholders. However, too much Non-Current Liabilities will have the opposite effect. It strains the company’s cash flow and compromises the long-term corporate financial health.

Relationship with Other Financial Statements

Long-Term Liabilities appears on the Balance Sheet. The Balance Sheet integrally links with the Income Statement and the Cash Flow Statement. Therefore, changes on the Income Statement and the Cash Flow Statement will trickle over to the Balance Sheet. Some examples of how the Income Statement and the Cash Flow Statement can affect long term obligations are listed below.

  • Recognizing revenue (Income Statement) can decrease the value of long-term Deferred Revenue. On the other hand, receiving additional upfront payments from customers (Cash Flow Statement) for future delivery of products / services can increase long-term Deferred Revenue.
  • Borrowings and repayment of debt (Cash Flow Statement) can alter the value of Long-Term Debt.
  • Payment of income taxes (Cash Flow Statement) can decrease the value of long-term Deferred Income Taxes.

Conclusion

Long-Term Liabilities are obligations that do not require cash payments within 12 months from the date of the Balance Sheet. Another name for this is “Non-Current Liabilities”. Long-Term Liabilities are shown on the Balance Sheet.

Margin of Safety

By Valuation One Comment

What is Margin of Safety?

Margin of Safety is the cushion investors get on investments against potential risks. This cushion represents the extent to which negative events can damage the intrinsic value without compromising investors’ required investment returns.

Market Capitalization

By Valuation 5 Comments

What is Market Capitalization?

Market Capitalization (Market Cap) is the value of the company entitled to the shareholders based on the market price. Shareholders are the owners of the company. Therefore, Market Capitalization represents the total value that belong to the company owners.  Market Cap is calculated by multiplying the company’s total shares outstanding by the stock price.

McKinsey 7S Framework

By Management & Strategy No Comments

What is the McKinsey 7S Framework?

The McKinsey 7S Framework is a framework that consists of seven interdependent internal elements that must be aligned for an organization to achieve success. McKinsey consultants developed this framework in the late 1970s and featured it in the book In Search of Excellence”, by former McKinsey consultants Thomas J. Peters and Robert H. Waterman.

The seven elements are: Strategy, Structure, Systems, Skills, Staff, Style, and Shared Values. Each element must be aligned with the others to create a cohesive and effective organizational system.

The framework helps organizations evaluate and improve their internal alignment and effectiveness. It is used to identify areas of strength and weakness within an organization and to develop strategies for improving performance.

One of the benefits of using the 7S Framework is that it provides a holistic approach to organizational improvement. It takes into account all of the key elements that contribute to organizational success and helps to identify areas for improvement. Another benefit is that the framework is applicable in a variety of contexts, from large corporations to small non-profits. It is adaptable to different industries and organizational structures, making it a versatile tool for improving organizational effectiveness.

McKinsey 7S FrameworkStrategy

The strategy element of the McKinsey 7S Framework refers to the organization’s plan for achieving its goals. This includes the company’s mission, vision, and strategic objectives. The strategy element is an essential part of the framework, as it sets the direction for the organization and determines its priorities and goals.

The strategy element involves several key components, including the organization’s mission statement, its long-term goals and objectives, and its competitive strategy. The mission statement is a clear and concise statement that defines the organization’s purpose and values. It serves as a guide for decision-making and helps to align the organization’s activities with its overall goals.

Long-term goals and objectives are specific, measurable targets that the organization aims to achieve over a period of several years. These goals should be aligned with the organization’s mission and vision and should be achievable within the organization’s resources and capabilities.

Competitive strategy refers to the organization’s approach to competing in the market. This includes the organization’s positioning, pricing, and product/service offerings. The competitive strategy should be aligned with the organization’s mission and long-term goals and should take into account the organization’s strengths, weaknesses, opportunities, and threats.

To develop an effective strategy, organizations must conduct a thorough analysis of their internal and external environment. This involves analyzing the organization’s strengths and weaknesses, as well as the opportunities and threats presented by the external environment.

Once the analysis is complete, the organization can develop a clear and comprehensive strategy that aligns with its mission and vision and takes into account the internal and external environment. The strategy should be communicated clearly to all members of the organization and should be regularly reviewed and updated as needed.

Structure

The structure element of the McKinsey 7S Framework refers to the formal and informal systems, processes, and hierarchies that make up the organization. This includes the reporting structure, decision-making processes, and communication channels. The structure element is an important aspect of the framework, as it defines how work is organized and how decisions are made within the organization.

The reporting structure defines the formal hierarchy within the organization, including the roles and responsibilities of each position. The decision-making process defines how decisions are made within the organization, including who has the authority to make decisions and how decisions are communicated to the rest of the organization. Communication channels are the formal and informal methods used to communicate within the organization, including email, meetings, and other forms of communication. Effective communication channels are essential for ensuring that information is shared effectively and that decisions are communicated clearly to all members of the organization.

To create an effective structure, organizations must evaluate their current structure and identify areas for improvement. This may involve changing the reporting structure, clarifying decision-making processes, or improving communication channels. It is important to ensure that the structure aligns with the organization’s mission and strategy and enables the organization to achieve its goals.

In addition to formal systems and processes, the structure element also includes informal aspects of the organization, such as culture and norms. These informal aspects can have a significant impact on the organization’s effectiveness and must be taken into account when evaluating and improving the structure.

Systems

The systems element involves several key components, including technology, procedures, and policies.

The technology used by the organization should support the work being done and should be appropriate for the organization’s size and needs. This may include software, hardware, and other tools used to support work. Procedures are the formal and informal methods used to carry out work within the organization. These procedures should be clear and easy to follow, and should support the organization’s overall goals and objectives. Policies are the rules and guidelines that govern how work is done within the organization, and should align with the organization’s values and strategic goals.

To create an effective systems element, organizations must evaluate their current technology, procedures, and policies and identify areas for improvement. This may involve upgrading technology to support more efficient work, creating clear and consistent procedures, and updating policies to align with the organization’s values and goals.

Skills

The skills element involves several key components, including the knowledge, experience, and abilities of the employees, as well as the organization’s culture and values. The employees within the organization should have the necessary knowledge and skills to carry out their work effectively, and should be aligned with the organization’s overall goals and objectives.

In addition to the knowledge and abilities of the employees, the culture and values of the organization are also an important part of the skills element. The culture of the organization should be aligned with the organization’s mission and vision, and should support the organization’s goals and objectives. The values of the organization should also be clear and consistent, and should be reflected in the behavior of the employees.

To develop an effective skills element, organizations must evaluate the knowledge, experience, and abilities of the employees, as well as the culture and values of the organization. This may involve developing training programs to improve employee knowledge and skills, hiring employees with the necessary expertise, and developing a culture that supports the organization’s strategic goals.

In addition to formal training and development programs, organizations can also support employee skills development through informal methods, such as mentoring and coaching. These methods can help employees develop new skills and gain the knowledge and experience needed to support the organization’s goals.

Staff

The staff element involves several key components, including the roles and responsibilities of each employee and the relationships among employees. This element is closely related to the skills element, as it involves the people within the organization, but focuses more on the roles that people play and their interpersonal relationships.

The roles and responsibilities of each employee should be clearly defined, and should align with the organization’s overall goals and objectives. This ensures that everyone within the organization is working towards a common goal.

The relationships between employees are also an important part of the staff element. Strong relationships between employees can lead to better collaboration and communication, and can improve the overall effectiveness of the organization. It is important for the organization to foster a positive culture that encourages collaboration and teamwork.

Style

The style element involves several key components, including the leadership style of the organization’s top executives, the management practices that are used within the organization, and the overall culture of the organization. The style element is particularly important in determining how the organization adapts to change and how it responds to challenges.

The leadership style of the organization’s top executives is a key component of the style element. The style of leadership can impact the overall culture of the organization, and can determine how the organization responds to change and uncertainty. Effective leaders are able to inspire and motivate their teams, and are able to create a positive and supportive culture within the organization.

In addition to the leadership style, the management practices used within the organization are also an important part of the style element. Effective management practices can improve efficiency and productivity, and can create a positive culture within the organization. Management practices may include things like goal-setting, performance evaluations, and employee recognition programs.

The overall culture of the organization is another important aspect of the style element. The culture of the organization can be influenced by the leadership style and management practices, and can impact how the organization responds to change and uncertainty. A positive culture that values collaboration, innovation, and continuous improvement can help the organization to adapt to changing circumstances and achieve its goals.

To develop an effective style element, organizations must evaluate their current leadership style, management practices, and overall culture. This may involve developing training programs to improve leadership skills, implementing new management practices to improve efficiency and productivity, and fostering a positive culture that supports collaboration and innovation.

Shared Values

The shared values element of the McKinsey 7S Framework refers to the guiding principles and beliefs that underpin an organization’s culture and strategy. This element is focused on the fundamental values that shape the behavior and decision-making of employees within the organization.

Shared values are important because they serve as a common foundation for decision-making, and help to align the organization’s goals and objectives with its culture and values. When shared values are effectively communicated and adopted by employees throughout the organization, they can help to foster a sense of community and shared purpose, and can support collaboration and teamwork.

The shared values element involves several key components, including the values that are important to the organization, the culture of the organization, and the communication and adoption of shared values throughout the organization.

The values that are important to the organization are a key component of the shared values element. These values may include things like integrity, innovation, customer focus, and employee empowerment. The values should be aligned with the organization’s overall goals and objectives, and should serve as a foundation for decision-making and behavior within the organization.

The communication and adoption of shared values throughout the organization is also an important aspect of the shared values element. Organizations must communicate their values clearly and consistently, and must ensure that employees at all levels of the organization understand and embrace these values. This may involve developing training programs, promoting open communication channels, and recognizing and rewarding employees who embody the organization’s values.

7S Framework Example: Apple & Steve Jobs

One company that successfully applied the 7S Framework is Walmart. In the early 2000s, Walmart’s growth had slowed and its profits had stagnated. Walmart’s management team used the McKinsey 7S Framework to identify areas for improvement and to develop a plan for change. Here are the specific actions they took for each element.

Strategy: Walmart’s management team developed a new strategy that focused on international expansion and diversification. The company entered new markets around the world and expanded its product offerings to include more upscale and niche products.

Structure: Walmart restructured its organization to create a more centralized decision-making process. The company also introduced new performance metrics to evaluate individual store performance and to better align incentives with the company’s overall goals.

Systems: Walmart invested heavily in new technology systems to improve supply chain management and inventory control. The company introduced a new system for tracking and ordering inventory in real-time, which helped to reduce waste and increase efficiency.

Skills: Walmart implemented a new training program for employees at all levels of the organization. The program focused on developing customer service skills, as well as technical skills related to the new systems and processes.

Staff: Walmart revised its hiring and promotion practices to focus more on employee performance and potential. The company also introduced a new employee feedback and recognition program to improve employee morale and engagement.

Style: Walmart’s management team adopted a more collaborative and open leadership style, encouraging feedback and ideas from all employees. The company also emphasized the importance of ethical and responsible business practices.

Shared Values: Walmart’s management team reinforced the company’s values of low prices and customer satisfaction. The company also placed a greater emphasis on sustainability and social responsibility, and established new initiatives to reduce waste and improve energy efficiency.

Learn More than Just 7S Framework

At Lumovest, we’re building the place where anyone can learn finance and investing in an affordable and easy-to-understand manner. Trust us, our courses are far more intuitive, visualized, logical and colloquial than your college professor-taught courses. Our courses are taught by Goldman Sachs investment banker who has worked on transactions worth over $50 billion. We designed our courses to prepare you to succeed in the world of high finance. You’ll learn how to conduct financial analysis exactly like how it’s done on Wall Street’s top firms. Upon completion of the courses, you will receive our Global Financial & Investment Analyst (GFIA) certification. You can sign up here.

Mid-Year Convention

By Valuation No Comments

What is Mid-Year Convention?

Mid-Year Convention is the practice of discounting future cash flow assuming receipt of cash flow evenly throughout the year. Mid-Year Convention is used in DCF analysis to better reflect the timing of cash flow.

Minority Interest

By Accounting No Comments

What is Minority Interest?

Minority Interest is the value of the minority equity in a subsidiary that the parent company does not own. So if a company owns 60% of a subsidiary and another company owns the remaining 40%, Minority Interest is the value of the 40%. Minority Interest appears on the Balance Sheet under the Liabilities section.

Morgan Stanley HireVue Questions – Investment Banking and Entry Roles

By Careers, Investment Banking Interview Questions No Comments

How HireVue Works

The Morgan Stanley HireVue questions are a critical component of the bank’s recruiting process. After you submit your MS application, the firm will email you a unique link to complete its HireVue interview. The interview will ask you a series of questions, usually behavioral in nature. For each question, you have to record a video of yourself on the spot answering the question. Therefore, make sure your computer has a functioning camera and microphone. In the beginning of the HireVue, the system will automatically test your camera and microphone. It will only allow you to start the assessment if both are working.

HireVue interviews are designed by the recruiting-technology firm HireVue. The system uses camera recordings to analyze candidates’ responses, facial movements, word choices and voice to generate an “employability” score. This means that as you work through the Morgan Stanley HireVue questions, you must be attentive to your delivery. Your delivery is just as important as the content of your response. Make sure to smile.

The questions are set by MS, not by HireVue. It will show you one question at a time. This means that you don’t get to see all the questions at once. You only get to see the second question after you submit your video recording for the first question. Each question comes with one retry. However, once you finish a question, you do not get to go back and edit it. Once the system shows you the question, it’ll give you some time to prepare your answer. Then the system will prompt your camera and microphone to start recording. When you see that the recording has began, you should deliver your answer.

Morgan Stanley HireVue Questions and Answers

OK, so now we understand how HireVue works. In this next section, we’ll go through the real Morgan Stanley HireVue questions for past Investment Banking Summer Analysts. We’ll look at the exact questions, provide our analysis on the approach, and show you illustrative answers.

In the past, Morgan Stanley usually ask candidates 2-3 questions. However, since 2022, Morgan Stanley has started asking more than 3 questions in HireVue. Most of Morgan Stanley’s HireVue questions are behavioral in nature. Whereas Goldman Sachs switch questions every year, Morgan Stanley tend to ask similar questions year after year. In other words, there’s a high probability that last year’s HireVue questions will appear again on this year’s HireVue.

Candidates must record a video response to each question. Each question comes with its own specified preparation time and recording time. Morgan Stanley usually gives 30 seconds of preparation time. After the 30 seconds is up, the system will automatically begin recording your answer. For each Morgan Stanley HireVue question, you must limit your answer to 1.5 minutes. You have 1 retry for each question.

You don’t have to use all of the allotted time. There isn’t a single “right” answer to each question per se. The “right” answers are ones that are clearly delivered and highlight your positive characteristics.

If you have a technical issue or disruption, don’t worry – you’ll have another chance to record your response. However, your second response will be automatically submitted and you’ll progress to the next question.

Please remember that these are past Morgan Stanley HireVue questions. There’s no guarantee that MS will use the same questions or assign the same time limit for future interviews.

Morgan Stanley HireVue Question #1

HireVue Question: What recent transaction interests you and why?

Lumovest Analysis: This is a very common Morgan Stanley HireVue question. It is specific for candidates applying to Morgan Stanley’s Investment Banking Division. While it may also appear for candidates applying to other roles, it is particularly common for the Investment Banking HireVue. Morgan Stanley has asked this question for several years. Therefore, we highly recommend all investment banking candidates to prepare for this question in advance. First, you should pick a transaction that occurred within the last 6 months. Second, you should pick a recent transaction that Morgan Stanley worked on. You should not pick a transaction that MS was not involved with. And third, you should be able to explain that transaction clearly and succinctly.

Sample Answer

A recent transaction that interests me is Elon Musk’s $44 billion acquisition of Twitter in an all-cash transaction. On this transaction, Morgan Stanley served as the lead M&A advisor to Elon Musk. Elon Musk, the founder of PayPal, Space X, Boring Company and Tesla, first announced in early April 2022 that he had purchased 9% of Twitter’s outstanding shares. Subsequently, he made an offer to purchase the entire Twitter for $54.20 per share. This is about a 38% premium to Twitter’s undisturbed stock price prior to Elon Musk announcing his 9% stake.

I found this transaction very interesting not only because I’m a Twitter user, but also because of how things transformed. The process involved various M&A hostile takeover tactics and defense mechanisms that I thought made the deal very interesting. Twitter was initially resistant to the acquisition and even adopted a poison pill. Elon Musk then indicated that he will launch a public tender offer. Other major shareholders also indicated their support for the sale. While the poison pill can prevent him from acquiring more shares, it can’t stop other shareholders from supporting Musk. Eventually, the Twitter board agreed to the deal and Morgan Stanley was able to carry this landmark transaction across the finish line.

Morgan Stanley HireVue Question #2

HireVue Question: Tell us about a time you knew things were not going well with a particular project, process, or activity. How did you know? What did you do to solve the problem?

Lumovest Analysis: This is another common Morgan Stanley HireVue question for investment banking candidates. We have seen Morgan Stanley ask this question and its variations for several years. One variation, for example, asks you to recollect “a time when you noticed something that didn’t appear right.” Slightly different wording, but inherently the same question. It’s OK to talk about a real experience that didn’t go well. In fact, these answers are oftentimes the most sincere.

Sample Answer

During the school year, I was a part-time investment banking intern at ABC Capital in Denver, Colorado. The firm was advising a publicly-traded company on a complicated transaction. The company was going to spin-off a business segment, enter into a sale leaseback on its corporate headquarters, and sell the remaining business to another strategic. So there were a lot of moving pieces of the puzzle in this transaction. The analyst on the team ran the entire financial model. Unfortunately, he left the firm midway in the transaction to pursue another opportunity.

My staffer staffed me on the transaction to replace the analyst. Because of the complexity of the model, I chose not to re-build it from scratch. However, I quickly realized that was a poor choice. A lot of the model outputs I made had errors and the numbers in different outputs frequently don’t tie. This happened numerous times and I can sense that the associate and vice president were losing patience.

I realized that the origin of the problem was that I didn’t have a full grasp over the model. It’s difficult for one person to fluently manipulate a model built by someone else. I would make one change in the model not fully appreciating how that will flow through the entire model. And so these inconsistencies would constantly happen. In the interest of putting a stop to all the mistakes, I invested a full weekend of work rebuilding the model from scratch so I can know exactly how the model works. And it paid off. I became aware of the different parts of the model I need to change for different outputs. Through this experience, I learned the importance of acquainting with the model when working on a new project.

Morgan Stanley HireVue Question #3

HireVue Question: What have you learned from your academic experience that can be applied to a career at Morgan Stanley?

Lumovest Analysis: This is a common and somewhat generic behavioral Morgan Stanley HireVue question. It’s a classic “HR” type of question. It’s not specific to the Investment Banking Division. It can appear in the HireVue for early insight programs as well as various divisional roles. In other words, you should prepare for this question no matter what division you apply to. Soft skills are important here. Some candidates overly focus on their hard technical skills that they learned in school. Soft skills are equally important, if not more important than raw finance technical skills for this question.

Sample Answer

I’m a sophomore at Princeton University double majoring in Biology and Spanish. Through my academic experience, I learned valuable lessons in communications, attention to details, and teamwork.

I discovered really early the importance of communications, thinking in the form of not only what I wanted to say, but also in the form of how the audience will interpret what I say. My studies in Spanish as my second language made this challenge especially visible to me. At Morgan Stanley, I will think about communications from the client’s perspective. This will steer me to create materials that optimize the message we’re trying to communicate.

Equally important is the attention to detail that my academic studies imparted upon me. In my biology lab studies, I have to be very vigilant and attentive to small details that might seem meaningless to outsiders. But the reality is that a small change in a minuscule detail can completely alter the results of a study. And so I naturally developed a habit of paying attention to the details and double checking my work. I think this is highly relevant for a career with Morgan Stanley.

And lastly, I learned how to work with others. Through my studies, I saw how a team’s effort can be far great than the sum of individual efforts. I learned how to be a good team player and put the team’s interests and needs in the first place. Morgan Stanley has a very team-driven culture, which is something that I really admire.

Are There No Technical Questions?

For entry-level positions, the most technical Morgan Stanley HireVue question is the one about a recent transaction that you follow. You should prepare for mostly behavioral questions for MS’s HireVue. 

Preparing for the Next Round After HireVUE

After you pass Morgan Stanley HireVUE questions, the next step is in-person interviews. These interviews can potentially be highly technical in nature. Having a strong finance technical foundation is a must.

Lumovest is the finest institution in the world to learn financial and investment analysis. Our courses are taught by Goldman Sachs investment banker. You’ll learn how to analyze financials and investments like how Goldman Sachs teaches its analysts and associates. Our lessons are interactive and visually intuitive. As a result, our courses are very practical and very relevant to what you’ll do on a day-to-day basis. By the end of the program, you’ll be able to conduct financial analysis on companies from the grounds up.

Developing a strong financial analytical skillset will help you stand out during the Morgan Stanley hiring process. Through our courses, you’ll learn accounting, financial modeling, LBO, DCF, M&A and valuation. At the end, you’ll receive an official blockchain-verified digital certification, which you can showcase on your resume. You can sign up here.

Related Readings

Net Income

By Accounting No Comments

What is Net Income?

Net Income is the amount of profit after deducting all expenses. A company’s Net Income is the profit remaining after paying for all operating and non-operating costs.

Net Interest Expense

By Accounting No Comments

What is Net Interest Expense?

Net Interest Expense is a company’s interest expense net of interest income. It’s a company’s cost from borrowing debt after being offset by the company’s earnings from the interest on its cash. Net Interest Expense = Interest Expense – Interest Income. It’s called Net Interest Income if Interest Income exceeds Interest Expense.

OEM – Original Equipment Manufacturer

By Uncategorised No Comments

OEM stands for Original Equipment Manufacturer. It’s actually a very easy term to understand. However, people often use the OEM term in several different and sometimes conflicting ways. This causes ambiguity and confusion. In this article, we’ll walk you through what OEM is in a very simple and easy to understand manner. People generally use the term Original Equipment Manufacturer (OEM) in three ways.

First OEM Meaning

First, OEM serves as a noun and means the manufacturer of components that make up the end product. For example, a car is an end product that has many different components. It has the engine, cooling system, fuel tanks, air filters, brakes, tires, etc. While brands, such as Toyota, BMW, Mercedes, and Ferrari, manufacture some components that go inside a car themselves, they don’t manufacture all the components. Instead, they rely on other companies that may specialize in manufacturing certain components.

In other words, different manufacturers produce these components and sell to car companies such as Toyota, BMW, Mercedes, Ferrari. These car companies then “assemble” these components together to produce a car under their brand. But while the car may have the Toyota / BMW / Mercedes / Ferrari brand, other manufacturers produced the components inside that car. These other manufacturers that produced the original equipment are called “Original Equipment Manufacturer” or OEM.

The need for the term OEM arises because while a car may be branded under one particular logo (i.e. a Lamborghini car), the components inside that car are actually manufactured by other companies. Hence, there’s a need for the term OEM to reference these manufacturers of the original equipment.

The key idea here is that while an item may belong to a brand, some other manufacturers likely manufactured the things inside that item. This phenomenon is very common in commerce. The manufacturers of these things are called “Original Equipment Manufacturers”.

OEM Original Equipment Manufacturer First Definition


First Meaning Example

Cars.com writes the following regarding OEM.

“The term relates to any company that manufactures parts for use in new vehicles. OEMs make a wide variety of components and hardware, such as exhaust systems, brakes, glass and electrical parts. Better known examples of OEMs are companies like ACDelco, which makes components used in the manufacture of new GM vehicles, and Motorcraft, which performs a similar role for Ford.”

The usage of the term here fits into our first definition.

Second OEM Meaning

Second, OEM serves as a noun and means the brand of the end product. For example, just like a car, a computer has many different components. It has the motherboard, the central processing unit (CPU), random access memory (RAM), graphics card, sound card, etc. While computer brands, such as Dell, Microsoft, HP, and Lenovo, manufacture some components that go inside a computer themselves, they don’t manufacture all the components. For example, many of these brands’ computers use Intel for CPU and NVIDIA for graphics card.

While companies like Intel, NVIDIA, AMD, and GeForce produce the things that go inside a computer, the computers are branded under Dell, HP, Lenovo, etc. In this case, the computer is the end product that consumers purchase. In the second OEM use case, it refers to the brands of the end product, which are Dell, HP, Lenovo, etc.

At this point, if you feel like this second meaning conflicts with the first meaning, you are correct. The second meaning is in direct contradiction to the first use case. Remember how we said earlier that people use the OEM term in several different and sometimes conflicting ways? This is it! Both cars and computers have components that go inside them. In one situation, it refers to the manufacturers of the components that make up an end product (cars). In another situation, it means the brand of the end product (computers) instead of the manufacturers of the components.

OEM Original Equipment Manufacturer Second Definition


Second Meaning Example

PC Magazine writes the following regarding OEM.

“Many of the largest PC vendors are OEMs, including HP, Dell and Lenovo. Essentially, any PC company that does not have its own manufacturing facilities is an OEM. The OEM often does not add anything to the equipment and merely brands it with its own logo.”

The usage of the term here fits into our second definition. As you can see, this second definition is in direct conflict with the first. Unfortunately, people use the term to mean both. You have to rely on context and clarifications in order to confirm what someone means when they say OEM.

Third OEM Meaning

Third, OEM serves as an adjective. It can mean being the same components as the original ones that came with the end product. It can also mean being manufactured by the manufacturer of the original components that came with the end product.

The owner of an end product often needs to replace components or parts within that end product. This is especially the case when the end product is an expensive item, such as a car or an airplane. For example, if you get into a car accident, it’s likely that you’ll need to replace some car components. When you shop for the replacement, you can choose between “OEM” and “Aftermarket”.

You’ll often hear people say “OEM parts”. That means parts that are either the original ones that came with the end product or ones manufactured by the same manufacturer. By contrast, “aftermarket parts” means parts that differ from the original ones or not made by the original manufacturer. OEM parts often fit perfectly with the end product and are more reliable than aftermarket parts. As a result, they are usually more expensive than aftermarket parts.

Third Meaning Example

Car Windshields writes the following regarding OEM and aftermarket parts.

“While OEM windshields can restore the default factory safety measures of the car against the harsh outside environment and flying debris, aftermarket windshields can also do the same, but sometimes either better or worse, depending on the quality of the materials. However, if you opt for the OEM alternative, there is already an assurance that the safety level you’ll get is the same as when you first bought the vehicle, and they meet the manufacturer’s safety standard. On the other hand, aftermarket glasses can’t guarantee safety because it depends on the different manufacturers’ standards.”

The usage of the term here fits into our third definition.

Financial & Investment Analysis

OEM is a term that you’ll commonly encounter in financial and investment analysis. This is especially the case if you’re analyzing the industrial or technology hardware sectors. Company filings, investor presentations and equity research reports often mention the OEM term for these sectors due to its strategic importance. We wrote this article after struggling with the fluidity of the usage of OEM. We found that OEM usage in one report is logically contradictory with the usage in another report. Hence, we hope this article can clear the air for you.

If you would like to learn more about our financial and investment analysis classes, please check out our curriculum and sign up here.

Paid-In Capital

By Accounting No Comments

What is Paid-In Capital?

Paid-In Capital is the total amount of money equity investors have invested into the company during stock issuances. Said differently, it’s the total amount of cash a company has raised from investors through stock issuances.

It’s called “Paid-In Capital” because it’s the total amount of money investors “paid in” during stock issuances. Common other names are “Contributed Capital”, “Contributed Surplus”, and “Share Capital”.

PESTEL Analysis

By Management & Strategy No Comments

What is PESTEL Analysis?

PESTEL Analysis is a strategic analysis framework that helps businesses understand the external factors that can impact their operations. PESTEL stands for Political, Economic, Social, Technological, Environmental, and Legal factors.

There are several benefits of conducting a PESTEL analysis. PESTEL analysis helps businesses better understand the external factors that can impact their operations, allowing them to make more informed decisions. By analyzing external factors, businesses can identify opportunities that they may not have been aware of otherwise. PESTEL analysis can also help businesses identify potential risks and develop strategies to mitigate those risks. In addition, it can inform strategic planning, helping businesses to align their operations with the external environment.

In this article, we’ll explore each of factor within PESTEL in greater detail, explain how they can impact a business, and provide real-world examples of how businesses have used PESTEL analysis to drive success.

PESTEL Analysis


Political Factors

Political factors refer to the influence of government and other political forces on a business. These factors can include government policies, political stability, and changes in regulations. Political factors can impact a business in a number of ways, such as changing market conditions, creating new opportunities, or introducing new risks.

Example: The tobacco industry is heavily impacted by political factors. Government regulations, taxes, and advertising restrictions have significantly impacted the industry’s profitability and growth potential.

Economic Factors

Economic factors refer to the overall economic conditions that can impact a business. These factors can include inflation, interest rates, exchange rates, and unemployment rates. Economic factors can impact a business by influencing consumer behavior, changing the availability of credit, and affecting the cost of production.

Example: During the 2008 financial crisis, many businesses were negatively impacted by economic factors such as rising unemployment rates, decreasing consumer spending, and tightening credit markets.

Social Factors

Social factors refer to the impact of society and culture on a business. These factors can include demographics, lifestyle trends, and consumer behavior. Social factors can impact a business by changing the demand for its products and services, creating new opportunities, or introducing new risks.

Example: The rise of health and wellness trends has created new opportunities for businesses in the health and fitness industry, while also posing a threat to businesses in the fast food and processed food industries.

Technological Factors

Technological factors refer to the impact of new technologies on a business. These factors can include advances in automation, the rise of e-commerce, and the emergence of new digital platforms. Technological factors can impact a business by changing the way it operates, creating new opportunities, or introducing new risks.

Example: The rise of e-commerce has significantly impacted traditional brick-and-mortar retailers, while creating new opportunities for businesses in the online retail space.

Environmental Factors

Environmental factors refer to the impact of the natural environment on a business. These factors can include climate change, natural disasters, and resource scarcity. Environmental factors can impact a business by changing the availability of resources, creating new risks, or introducing new opportunities.

Example: The renewable energy industry has experienced significant growth in recent years, driven in part by environmental factors such as concerns over climate change and the need for sustainable energy sources.

Legal Factors

Legal factors refer to the impact of laws and regulations on a business. These factors can include employment laws, consumer protection laws, and industry-specific regulations. Legal factors can impact a business by changing market conditions, creating new risks, or introducing new opportunities.

Example: The introduction of new data privacy regulations, such as GDPR in the EU, has impacted businesses across industries, creating new compliance requirements and risks.

PESTEL Analysis Example: Tesla

Tesla is a trailblazer in the electric vehicle industry, revolutionizing the traditional automotive industry with innovative technology and business strategies. The company has leveraged PESTEL analysis to identify opportunities and risks as it expands globally.

Political: Tesla has navigated political challenges in some markets, such as restrictions on direct-to-consumer sales in certain US states. However, the company has also leveraged political factors to its advantage, such as incentives for electric vehicle purchases. In 2021, Tesla’s sales in China increased by 124%, largely due to favorable government policies that promote electric vehicle adoption.

Economic: Tesla has responded to economic factors such as changes in consumer demand and currency fluctuations. The company introduced lower-priced models and financing options, leading to record vehicle deliveries in the first quarter of 2021, with 184,800 cars delivered worldwide.

Social: Tesla has capitalized on growing concerns about climate change and increasing demand for sustainable products. The company’s Model 3 became the best-selling electric vehicle in the world in 2020, with over 365,000 units sold globally.

Technological: Tesla has embraced technological innovation, such as autonomous driving capabilities and battery technology. In 2020, the company produced over 500,000 vehicles, with battery technology being a key driver of this production. Tesla’s battery technology has helped it maintain a competitive advantage in the electric vehicle industry.

Environmental: Tesla has prioritized environmental sustainability in its operations, such as implementing solar power and energy storage solutions in its products and factories. The company has committed to reducing carbon emissions and has made significant progress towards this goal. In 2020, Tesla’s total carbon emissions were 4.6 million metric tons, a decrease of 34% from the previous year.

Legal: Tesla has navigated legal challenges such as disputes over the use of its Autopilot system and allegations of labor violations. The company has also complied with local laws and regulations in each market where it operates, including safety regulations and environmental laws.

Overall, Tesla’s use of PESTEL analysis has helped the company disrupt the traditional automotive industry by identifying opportunities and risks in each market.

PESTEL Analysis Example: Airline Industry

If you are performing a PESTEL analysis on the airline industry, you can use the below as your starting blueprint and elaborate in greater detail each of the items we identified below in your research report.

Here we go.

Political: The airline industry is heavily regulated by governments worldwide, with regulations impacting everything from safety to route permissions. Political unrest and instability in certain regions can also impact airline operations. For example, during the Russo-Ukrainian War, the United States banned Russian airlines from flying over American airspace, significantly derailing Russian airlines’ flight operations.

Economic: Economic factors such as fuel prices, exchange rates, and consumer demand significantly impact the airline industry. High fuel prices can lead to increased costs for airlines, while low consumer demand can lead to lower revenue and profits.

Social: Social factors such as changing consumer preferences and demographics can impact the airline industry. For example, the rise of low-cost carriers has led to increased competition in the industry, as consumers prioritize lower prices over other factors.

Technological: Technological advancements such as the use of digital platforms, automation, and new aircraft models are revolutionizing the airline industry. Airlines that invest in these technologies can gain a competitive edge and improve their operations.

Environmental: The environmental impact of the airline industry has become a major concern, with airlines facing pressure to reduce their carbon emissions and implement sustainable practices. This can impact the industry through the introduction of new regulations and the development of alternative fuels and aircraft.

Legal: The airline industry is subject to a range of legal factors, including regulations related to safety, security, and competition. For example, airline mergers and acquisitions may face regulatory scrutiny from antitrust authorities.

Conclusion

PESTEL analysis is a powerful tool for businesses looking to understand the external factors that can impact their operations. By analyzing each of the six factors, businesses can identify opportunities and threats, develop strategies to mitigate risks, and align their operations with the external environment. By leveraging PESTEL analysis, businesses can position themselves for long-term success in an ever-changing business landscape.

Learn Finance to Support PESTEL Analysis

At Lumovest, we’re building the place where anyone can learn finance and investing in an affordable and easy-to-understand manner. Our courses are far more intuitive, visualized, logical and colloquial than your college professor-taught courses. Our courses are taught by Goldman Sachs investment banker who has worked on transactions worth over $50 billion. We designed our courses to prepare you to succeed in the world of high finance. You’ll learn how to conduct financial analysis exactly like how it’s done on Wall Street’s top firms. Upon completion of the courses, you will receive our Global Financial & Investment Analyst (GFIA) certification. You can sign up here.

Present Value

By Valuation No Comments

What is Present Value?

Present Value is the value of an asset today. It represents what an asset is worth “at present”. Therefore, it’s called “Present Value”.

Present Value is commonly used in DCF analysis to describe what a future amount of money is worth today.

Retained-Earnings

By Accounting One Comment

What is Retained Earnings?

Retained Earnings is the cumulative profit a company has earned that it hasn’t returned to shareholders through dividends yet. Said differently, it’s the cumulative amount of profit a company has retained within the company after paying dividends. Therefore, it’s called “Retained Earnings”.

Revenue Recognition

By Accounting No Comments

What is Revenue Recognition?

Revenue recognition is the accounting principle that governs how and when companies can record revenue. It’s a set of rules that standardize the way companies around the world measure revenue. It lays out the clear process and conditions that companies must follow in order to recognize any revenue.

Revenue is one of the most important metrics on the financial statements. It’s the first line on the Income Statement and influences all the lines that follow. How much revenue a company generates influences profit, cash flow and even valuation. Therefore, revenue is an essential metric in analyzing a company’s financial health and future prospects.

At a conceptual high level, companies recognize revenue when the following conditions are met.

  • The company has transferred the goods / services to the customer.
  • The collection of payment for the goods / services is reasonably certain.

In accounting language, we say that the collection of payment is probable and the company has satisfied the performance obligations. If you’re short on time, these two conditions are the key takeaways. The rest of this article will go over the revenue recognition standards in greater details.

For many businesses, revenue transactions are simple and straightforward. At a supermarket, customers take the product home and pay at the checkout counter. At a restaurant, customers consume the meal and pay on site. These companies provided the goods to the customer and the collection of payment was reasonably certain. However, there are also many other businesses with more complicated revenue transactions. These businesses rely on revenue recognition standards to guide them on when and how to record revenue.

Accounting Standards for Revenue Recognition

Sizable companies can’t just record revenue however they want. They must follow the revenue recognition rules set in the accounting standards. In the United States, companies follow the US GAAP maintained by the Financial Accounting Standards Board (FASB). For most of the rest of the world, companies follow the IFRS maintained by the International Accounting Standards Board (IASB).

Revenue Recognition Before May 2014

Prior to May 2014, revenue recognition policies were very problematic in both US GAAP and IFRS. The US GAAP was way too detailed. It had complex and disparate revenue recognition requirements for specific transactions and industries, such as software, real estate, and construction. As a result, different industries followed different accounting rules for economically similar transactions. By contrast, the IFRS was too lacking in details. It provided limited guidance and companies found the guidance difficult to apply. As a result, the FASB and the IASB worked together on a joint initiative to create a new set of revenue recognition accounting standards.

Revenue Recognition After May 2014

In May 2014, the FASB issued Topic 606, Revenue from Contracts with Customers. In the same month, the IASB issued IFRS 15, Revenue from Contracts with Customers. Along with other consequential amendments, these documents stipulate the new revenue recognition standards that companies around the world follow. The new standards also largely converged the US GAAP and IFRS revenue recognition requirements and eliminated most previous differences.

As previously explained in the first section, many businesses have very simple and straightforward revenue transactions. However, many other businesses have complicated revenue transactions. Examples include real estate construction arrangements, intellectual property licenses, and services with milestone payments. These might make it difficult to determine what the company has committed to deliver, the revenue amount and when revenue should be recorded.

Due to the convoluted nature of these transactions, companies and customers would enter into contracts. That’s why both the US GAAP and IFRS documentations reference “contracts with customers”. The new standards use these contracts with the customers as the basis for recording revenue.

The 5-Step Revenue Recognition Process

Under the new standards, both the US GAAP and the IFRS adopted a 5-step process to recognize revenue.

  1. Identify the contract with a customer.
  2. Identify the performance obligations (promise) in the contract.
  3. Determine the transaction price.
  4. Allocate the transaction price to the performance obligations in the contract.
  5. Recognize revenue when (or as) the reporting organization satisfies a performance obligation.

Companies must believe that the collection of payment is reasonably certain (“probable”) before they commence the 5-step process.

Step 1: Identify the Contract

The first step in applying the new revenue recognition standard is to identify the contract with a customer. This is very straightforward. The key here is that the counterparty to the contract must be a customer. Contracts that are not with customers are outside the scope of the revenue recognition standard.

For example, Company A signs contract with Company B to jointly build a mall whereby Company B will control the mall and pay a fixed amount of money to Company A. Should Company A recognize the money it receives from Company B as revenue? It depends. If Company A and Company B are acting as partners, then Company A can’t recognize the payments as revenue. Company A might have to categorize the payments as dividend payments or investment income. If Company B is a customer receiving service from Company A, then Company A may recognize the payment as revenue.

Step 2: Identify the Performance Obligations

The second step in applying the new revenue recognition standard is to identify the performance obligations in the contract. Under the new standards, performance obligations are the unit of account. Therefore, performance obligations serve as the basis for how and when to recognize revenue. Management needs to evaluate whether to categorize multiple promised goods / services separately or as a single obligation.

In many businesses, the performance obligation is very straightforward. For example, in a restaurant, the performance obligation is likely the service of meals to the customer. The following are other examples of performance obligations.

  • Netflix granting access to its shows and movies for a monthly subscription.
  • Apple delivering iPhone that customer ordered on its website.
  • Citibank safeguarding the money that customers deposited.

Step 3: Determine the Transaction Price

The third step in applying the new revenue recognition standard is to determine the transaction price. The transaction price is the amount a company expects to be entitled in exchange for goods or services transferred. Management should take into account both fixed and variable considerations of the transaction price.

A common question people have is whether companies record sales taxes in revenue. The new standards state that amounts collected on behalf of third parties should be excluded. Companies collect sales taxes on behalf of the government. Therefore, companies may not include sales taxes in revenue.

Step 4: Allocate the Transaction Price

The fourth step in applying the new revenue recognition standard is to allocate the transaction price. The objective is to allocate the transaction price to each performance obligation. The amount allocated should depict the amount the company expects to be entitled for fulfilling that obligation.

Here’s a key concept. The transaction price should be allocated to each performance obligation based on the relative standalone selling prices of the goods or services being provided to the customer. For example, let’s take a look at Microsoft. Suppose Microsoft sells its Surface laptop for $1,000 and Office 365 for $500. If a customer were to purchase the laptop on its own, then the standalone selling price is $1,000. And if the customer were to purchase bot the laptop and Office 365 separately, the total price is $1,500. But what if Microsoft sells the Surface laptop with Office 365 to a customer as a bundle for $1,300? How should Microsoft recognize revenue from the sale of laptop versus from the sale of Office 365?

Using the standalone selling prices, Microsoft should calculate the laptop revenue as ($1,000 / $1,500) x $1,300. Similarly, Microsoft should calculate Office 365 revenue as ($500 / $1,500) x $1,300. Therefore, Microsoft should allocate $866.67 of revenue to the laptop and $433.33 of revenue to Office 365.

Step 5: Recognize Revenue

The fifth and final step in applying the new revenue recognition standard is to recognize the revenue. The accounting standards require companies to recognize revenue when performance obligations are satisfied. A performance obligation is satisfied when the “control” of the promised good or service is transferred to the customer.

Remember that companies must determine that the collection of payment is probable before they even commence the 5-step process. Therefore, the two conditions to recognize revenue are what we stated in the beginning.

  • The collection of payment for the goods / services is reasonably certain.
  • The company has transferred the goods / services to the customer.

Conclusion

Revenue recognition is a set of accounting rules that govern how and when companies may record revenue. It used to be very complicated with different rules for different industries and major discrepancies between US GAAP and IFRS. After 2014, the FASB and the IASB introduced a 5-step process that standardizes how companies recognize revenue. Companies recognize revenue when the collection of payment is probable and performance obligation is satisfied.

SG&A Expense

By Accounting No Comments

SG&A Expense, or SG&A for short, stands for Selling, General & Administrative Expense. SG&A is a major line on the Income Statement. It represents the expenses a company incurs related to marketing and administering the company. All companies incur at least some amount of SG&A Expense. That’s because all businesses need to promote their products and services and all businesses need to have some administrative functions. Therefore, all companies will have SG&A though they might not necessarily use that exact name on the financial statements.

Breaking Down SG&A Expense

As a reminder, SG&A stands for Selling, General & Administrative. To better understand this line item, it helps to disaggregate SG&A into two parts. First, we’ll look at what “Selling” typically includes. Then, we’ll go over what’s included in “General & Administrative”.

Selling (S)

The first part of SG&A Expense are selling expenses. These are expenses a company incurs to “make the sale”. In order to make the sale, a company will need to promote itself and its products and services. Examples of selling expenses include salary and commission to the company’s sales people. Other examples include paying advertisements and organizing promotional events. These activities create demand for the company’s business and broadly categorized as “selling”. Therefore, the expenses a company incurs due to these selling activities are included in the SG&A Expense.

It is unlikely a successful business can sell its products and services without any selling activities. That’s because businesses need to inform customers of their existence and educate the customers about their products. In addition, most businesses have competition that target the same customers for the same products. To attract the customers, businesses must promote and market themselves.

General & Administrative (G&A)

The second part of SG&A Expense are general & administrative expenses. Companies incur these expenses in order to keep their business running. Every company, no matter how efficient, will incur at least some sort of administrative expense. For example, general & administrative expenses include the salary and bonus to the company’s management team. It also includes the compensation to the company’s personnel in administrative functions, such as finance, legal, and human resources. Aside from personnel cost, a company will also need to pay office rent, buy office supplies and pay utilities. These are expenditures a company must incur in order to keep it running on a day-to-day basis.

Similar to selling, it’s extremely unlikely that a successful business can scale and grow without any administrative activities. That’s because businesses can’t operate automatically. Humans must manage the businesses in order for them to function, which creates administrative expenses.

SG&A Expense on the Income Statement

SG&A is usually reported on the Income Statement as an operating expense. This means that SG&A is reported after total sales (revenue) but before operating income. SG&A is one of the expenses subtracted from total sales (revenue) in order to calculate operating income.

Most companies group record SG&A as a single line on the Income Statement. For example, here’s a snapshot of Apple’s Income Statement. Apple groups selling, general and administrative activities together into a single expense line.

Apple SG&A

Other companies prefer to break SG&A into two parts. These companies usually report a line for Sales & Marketing and a separate line for General & Administrative. Here’s an example of Facebook’s Income Statement. Facebook prefers to break SG&A into two parts: “Marketing and Sales” and “General and Administrative”.

Facebook SG&A

How to Forecast SG&A Expense

While it’s important to know a company’s historical SG&A Expense, it’s also helpful to forecast future SG&A Expense. So, how do financial analysts forecast SG&A? Broadly speaking, there are three ways to forecast SG&A.

The first way to forecast SG&A Expense is by growing it by a certain rate year after year. For example, let’s say a company incurred $1,000 of SG&A Expense this year. If we forecast it to grow by 5%, then that means we’re estimating $1,050 of SG&A Expense next year.

The second way to forecast SG&A Expense is by projecting it as a percentage of revenue. In practice, many large corporations budget their SG&A expenditures based on how much revenue the company will generate. For example, let’s say a company will generate $5,000 of revenue next year. If the company spends 20% of revenue on SG&A, then that implies $1,000 of SG&A Expense next year.

The third way to forecast SG&A Expense is by projecting the components that make up SG&A and adding them up. Imagine a company will spend $300 on advertising, $400 on office rent, and $500 on manager salary next year. Assuming that these are all the company spends on SG&A, then we can add them up, which totals $1,200. This method is less common than the other two methods because detailed breakdown of SG&A is not usually publicly available.

Conclusion

SG&A stands for Selling, General & Administrative. It captures the costs incurred to market and administer a company. SG&A is a common line item on the Income Statement. Analysts can forecast SG&A with a growth rate, as a percentage of revenue, or through the sum of its components.

Share Capital

By Accounting No Comments

What is Share Capital?

Share Capital is the total sum of money investors have invested into the company through share issuances. Said differently, it’s the total amount of money a company raised from investors by issuing shares.

It’s called “Share Capital” because it’s the capital obtained by selling shares in the company. It has other names, such as “Paid-In Capital”, “Contributed Surplus”, and “Contributed Capital”.

Should we use forward multiples or trailing multiples?

By Investment Banking Interview Questions No Comments

The investment banking interview question we’re going to go over today is “Should we use forward multiples or trailing multiples?” Forward multiples are based on future financials while trailing multiples are based on past financials. In other words, the former is forward-looking while the latter is backward-looking. We’ll walk you through exactly how to phrase your answer to this interview question. Here’s what you can say for your answer to our question today.

Interview Answer

“It depends. In general, when we’re valuing companies on a standalone basis, we usually want to use forward multiples. That’s because by using the forward multiple, we can take future growth into account. And growth is very important for equity investors.  

However, when we are using the multiple to calculate the purchase price in a merger model or a LBO model, we usually want to use it on a trailing basis. That’s because the transaction will likely require debt financing and debt investors would want to look at multiples on a trailing basis because they don’t benefit from future growth. They care more about sustaining what the company is currently earning. And so to be on the same page as the creditors, we use trailing multiples for these transactions.”

Additional Tip

In short, that’s how you answer the question: “Should we use forward multiples or trailing multiples”. Remember, equity investors want the business to grow because they can get unlimited upside. So they care more about the future. Credit investors just want the business to sustain itself. They don’t benefit from the growth. What the company has already accomplished is more important to them so they care more about the past.

More IBD Interview Questions

Raising debt affect a company’s P/E multiple

How do we decide between using EV/EBITDA vs. EV/Sales?

How would you value an apple tree?

Six Sigma

By Management & Strategy No Comments

What is Six Sigma?

Six Sigma is a data-driven approach that helps businesses improve their processes to maximize the quality of their products and services while minimizing defects.

In other words, Six Sigma is a method to manage product / service quality. The ultimate goal of Six Sigma is to achieve a level of quality that meets or exceeds customer expectations while minimizing costs and maximizing profits.

Implementing this method can lead to numerous benefits for businesses, including improved quality and efficiency, reduced costs, increased customer satisfaction, and higher profitability. By focusing on data and process improvement, businesses can achieve greater consistency and predictability in their operations. It also encourages a culture of continuous improvement, where businesses are constantly seeking ways to improve their processes and stay ahead of the competition.

By using Six Sigma, businesses can identify areas for improvement and measure progress towards achieving their goals. In this article, we will discuss the key principles of Six Sigma, its benefits, and how it can be implemented in business.

Six Sigma Methodology

Six Sigma methodology is a data-driven approach that relies on statistical analysis to identify areas for improvement and measure progress towards achieving process improvement goals. This methodology is focused on reducing the variability and defects of the business processes. The methodology consists of five phases: Define, Measure, Analyze, Improve, and Control (DMAIC). The key activities of each phase are discussed below.

Six Sigma


The Define phase is the starting point of the methodology. In this phase, businesses identify the problem they want to solve, define the scope of the project, and establish a team to work on the project. This team is responsible for managing the project and implementing the changes that will be required to achieve the desired outcomes.

The Measure phase is focused on collecting data on the process being evaluated. This data is then used to establish a baseline for performance, which will be used to evaluate the effectiveness of the process improvement efforts.

The Analyze phase involves analyzing the data collected in the previous phase to identify root causes of defects and inefficiencies in the process. In this phase, businesses use statistical tools to identify the most significant factors affecting the process and prioritize their improvement efforts accordingly.

The Improve phase involves developing and implementing solutions to address the root causes identified in the Analyze phase. This phase is focused on identifying and testing potential solutions, and then implementing the best solution to achieve the desired outcomes.

The Control phase involves monitoring the process to ensure that the improvements made in the Improve phase are sustained over time. This phase includes ongoing monitoring, auditing, and refinement of the process to ensure that it continues to deliver the desired outcomes.

Implementing Six Sigma

Implementing Six Sigma requires a commitment from all levels of the organization, from top management to frontline employees. Businesses must also provide appropriate training and support to ensure successful implementation. Training typically involves classroom instruction, hands-on projects, and mentoring from experienced professionals.

Implementing Six Sigma can lead to numerous benefits for businesses, including improved quality and efficiency, reduced costs, increased customer satisfaction, and higher profitability. By focusing on data and process improvement, businesses can achieve greater consistency and predictability in their operations. Six Sigma also encourages a culture of continuous improvement, where businesses are constantly seeking ways to improve their processes and stay ahead of the competition.

Real World Example: Ford Motor

Ford Motor Company is a well-known example of a business that has successfully implemented Six Sigma. In the early 2000s, Ford faced numerous challenges related to quality, efficiency, and profitability. The company’s processes were plagued by defects, inefficiencies, and waste, which led to high costs, low customer satisfaction, and declining profits.

To address these challenges, Ford adopted Six Sigma as a key part of its quality management program. The company launched a comprehensive initiative aimed at identifying and eliminating defects in its processes.

One of the most significant improvements Ford achieved through Six Sigma was in its manufacturing processes. By applying Six Sigma methodologies to its production lines, the company was able to reduce defects, minimize waste, and increase efficiency.

Another area where Six Sigma had a significant impact on Ford was in its supply chain management. By using Six Sigma to improve its procurement processes, Ford was able to reduce lead times, increase on-time deliveries, and reduce costs. This helped the company to become more competitive and better able to meet customer demand.

Ford’s commitment to Six Sigma also had a positive impact on its workforce. By providing employees with Six Sigma training, the company was able to create a culture of continuous improvement, where employees were encouraged to identify and solve problems. This led to increased employee engagement, higher productivity, and improved morale.

In conclusion, Ford’s adoption of Six Sigma played a key role in its turnaround in the early 2000s. By using Six Sigma to identify and eliminate defects in its processes, the company was able to improve quality, reduce costs, and increase customer satisfaction. Through its commitment to Six Sigma, Ford was able to create a culture of continuous improvement that helped it to stay ahead of the competition and achieve long-term success.

Real World Example: Children’s Hospital of Philadelphia (CHOP)

Another example of Six Sigma in the healthcare industry is the case of the Children’s Hospital of Philadelphia (CHOP). CHOP is a leading pediatric hospital that provides a wide range of services, including primary care, specialty care, and research.

In 2007, CHOP launched a Six Sigma initiative aimed at improving patient care and reducing costs. The hospital faced numerous challenges related to patient wait times, patient flow, and staff efficiency, which led to high costs and long wait times for patients.

By using Six Sigma methodologies, CHOP was able to identify areas for improvement and implement solutions that resulted in significant improvements in patient care and efficiency. For example, the hospital used Six Sigma to streamline patient flow, reduce wait times, and improve patient satisfaction.

One of the key improvements CHOP achieved was in its radiology department. By using Six Sigma tools to analyze the radiology process, the hospital was able to identify bottlenecks and inefficiencies that were causing long wait times for patients. The hospital implemented a new process that reduced wait times by 30%, increased patient satisfaction, and reduced costs.

CHOP also used Six Sigma to improve its discharge process, which had been a major source of patient complaints. By analyzing the discharge process, the hospital was able to identify root causes of delays and develop a new process that reduced patient wait times and increased efficiency.

The Six Sigma initiative at CHOP had a significant impact on patient care and efficiency, leading to higher patient satisfaction, lower costs, and improved outcomes. The hospital was able to create a culture of continuous improvement, where staff were encouraged to identify and solve problems, leading to sustained improvements over time.

Six Sigma Belt Rankings

Six Sigma is a data-driven approach to process improvement that relies on a team of experts with different levels of expertise. These experts are known as Six Sigma Belt holders and are categorized into different levels based on their skills and knowledge.

There are five Six Sigma belt levels: White Belt, Yellow Belt, Green Belt, Black Belt, and Master Black Belt. Each belt level represents a different level of expertise, with higher belt levels indicating greater experience and knowledge.

  1. White Belt: The White Belt level is the entry-level belt and is designed for individuals who are new to Six Sigma. White Belt holders have a basic understanding of Six Sigma concepts and tools and can contribute to improvement projects.
  2. Yellow Belt: The Yellow Belt level is the next level up and is designed for individuals who have a basic understanding of Six Sigma concepts and tools. Yellow Belt holders work on improvement projects and assist Green Belt and Black Belt holders.
  3. Green Belt: The Green Belt level is the intermediate level and is designed for individuals who have a solid understanding of Six Sigma and can lead improvement projects. Green Belt holders work under the supervision of Black Belt holders and can lead small-scale Six Sigma projects.
  4. Black Belt: Black Belt holders are experts in Six Sigma and are able to lead complex projects and train others in Six Sigma methodologies. They have a deep understanding of Six Sigma tools and techniques and are able to analyze data to identify process improvements.
  5. Master Black Belt: The highest level of Six Sigma expertise is the Master Black Belt level. Master Black Belts are the most experienced Six Sigma practitioners and are responsible for leading large-scale Six Sigma initiatives, mentoring Black Belts, and coaching other Six Sigma professionals.

Learning Six Sigma

Certifications: There are several certification programs available, such as ASQ and IASSC. Each program has different requirements and levels of certification, such as White Belt, Yellow Belt, Green Belt, Black Belt, and Master Black Belt.

Time Commitment: The estimated time requirement for each belt level may vary depending on the certification program and the individual’s pace of learning. However, here is a general estimation of the time required for each belt level.

  1. White Belt: This is the entry-level certification and can typically be completed within a day or two.
  2. Yellow Belt: This level requires a basic understanding of Six Sigma concepts and can take a few days or weeks to complete.
  3. Green Belt: This intermediate level requires more in-depth knowledge and can take several weeks to a few months to complete.
  4. Black Belt: This level requires expertise in Six Sigma methodologies and can take several months to a year to complete.
  5. Master Black Belt: This is the highest level of certification and can take several years to achieve, as it requires significant experience and expertise in leading large-scale Six Sigma projects.

It’s important to note that these time estimates are general and can vary depending on the certification program and the individual’s pace of learning. Some certification programs may require more or less time, and some individuals may take longer or shorter to complete each level depending on their experience and dedication.

Learning More

At Lumovest, we’re building the place where anyone can learn finance and investing in an affordable and easy-to-understand manner. Our courses are far more intuitive, visualized, logical and colloquial than your college professor-taught courses. Our courses are taught by Goldman Sachs investment banker who has worked on transactions worth over $50 billion. We designed our courses to prepare you to succeed in the world of high finance. You’ll learn how to conduct financial analysis exactly like how it’s done on Wall Street’s top firms. Upon completion of the courses, you will receive our Global Financial & Investment Analyst (GFIA) certification. You can sign up here.

SWOT Analysis

By Management & Strategy No Comments

What is SWOT Analysis?

SWOT analysis is a strategic planning tool used to evaluate the strengths, weaknesses, opportunities, and threats of an organization or project. The acronym SWOT stands for Strengths, Weaknesses, Opportunities, and Threats.

SWOT analysis has its roots in the business world, where it has been used since the 1960s to help organizations assess their competitive position and develop strategies for growth. The concept was first introduced in a 1960 paper by management consultant Albert Humphrey.

The analysis involves examining internal factors, such as the organization’s strengths and weaknesses, as well as external factors, such as market trends and competition. This allows organizations to identify areas where they excel and areas where they need improvement, as well as opportunities for growth and potential threats to their success.

One of the key benefits of SWOT analysis is that it provides a structured framework for evaluating an organization’s position and making informed decisions. By identifying strengths and weaknesses, organizations can better allocate resources and develop strategies to address areas that need improvement. Similarly, by identifying opportunities and threats, organizations can proactively respond to changes in the market and stay ahead of the competition.

SWOT analysis can be used in a variety of contexts, from evaluating a company’s overall position to assessing the viability of a specific project or initiative. It is a versatile tool that can be adapted to meet the needs of different organizations and industries.

Strengths

Strengths refer to the positive internal attributes or characteristics of an organization that give it a competitive advantage over others in its industry.

Identifying strengths is an important first step in a SWOT analysis because it helps organizations understand what they do well and what sets them apart from the competition. This information can be used to develop strategies that leverage those strengths and capitalize on them to achieve greater success. Strengths can come in many forms, such as:

  • Brand recognition and reputation
  • Unique products or services
  • Strong financial position
  • Highly skilled and motivated workforce
  • Patented technology or intellectual property
  • Strong customer relationships
  • Efficient operations and supply chain management

Identifying strengths requires an honest and objective evaluation of an organization’s internal capabilities and resources. This can be done through surveys, focus groups, or other forms of market research, as well as through internal analysis of financial and operational data.

Once strengths are identified, organizations can use them to their advantage by developing strategies that capitalize on those strengths. For example, a company with a strong brand and reputation may focus on increasing brand awareness through advertising and public relations campaigns. A company with patented technology may invest in research and development to create new products that leverage that technology.

Overall, identifying and leveraging strengths is a key component of successful strategic planning. By understanding what sets them apart from the competition, organizations can develop strategies that capitalize on their strengths and help them achieve their goals.

Weaknesses

Weaknesses refer to the negative internal attributes or characteristics of an organization that can hinder its ability to compete in its industry.

Identifying weaknesses is an important step in a SWOT analysis because it helps organizations understand what areas they need to improve in order to remain competitive. This information can be used to develop strategies that address those weaknesses and help the organization overcome them. Weaknesses can come in many forms, such as:

  • Poor financial position or lack of resources
  • Outdated technology or infrastructure
  • Lack of brand recognition or reputation
  • Inefficient operations or supply chain management
  • Low employee morale or high turnover rates
  • Inadequate marketing or sales strategies
  • Lack of strategic partnerships or alliances

Identifying weaknesses requires an honest and objective evaluation of an organization’s internal capabilities and resources. This can be done through surveys, focus groups, or other forms of market research, as well as through internal analysis of financial and operational data.

Once weaknesses are identified, organizations can develop strategies to address them. For example, a company with outdated technology may invest in new infrastructure or systems to improve its operations. A company with low employee morale may focus on improving its company culture or providing training and development opportunities.

Opportunities

Opportunities refer to the external factors or circumstances that can be leveraged by an organization to achieve its goals.

Identifying opportunities is an important step in a SWOT analysis because it helps organizations understand where they can focus their resources to achieve the greatest impact. This information can be used to develop strategies that capitalize on those opportunities and help the organization achieve its goals. Opportunities can come in many forms, such as:

  • New market trends or emerging technologies
  • Changes in regulations or government policies
  • Shifts in consumer behavior or preferences
  • Strategic partnerships or collaborations
  • Acquisition or merger opportunities
  • Changes in the competitive landscape
  • Economic or industry growth

Identifying opportunities requires an understanding of the external environment in which an organization operates. This can be done through market research, industry analysis, and monitoring of trends and changes in the business environment.

Once opportunities are identified, organizations can develop strategies to take advantage of them. For example, a company operating in a growing industry may focus on expanding its product offerings to capitalize on the increased demand. A company with a strong reputation may use that reputation to build strategic partnerships with other organizations in its industry.

Threats

Threats refer to external factors or circumstances that may hinder or pose a risk to an organization’s ability to achieve its goals.

Identifying threats is crucial in developing effective strategies that mitigate potential negative impacts on the organization. Threats can come from a variety of sources, such as:

  • Economic downturns or shifts in consumer spending
  • New competitors or disruptive technologies
  • Changes in regulations or government policies
  • Shifting market trends or consumer preferences
  • Natural disasters or other external events

To identify potential threats, organizations should conduct a thorough analysis of the external environment in which they operate. This can be done through market research, industry analysis, and monitoring of trends and changes in the business environment.

Once threats have been identified, organizations can develop strategies to mitigate their potential impact. For example, a company facing increased competition may focus on differentiating its products or services to maintain its market position. A company operating in a region prone to natural disasters may develop contingency plans to ensure business continuity in the event of a disaster.

It is important to note that threats may not always be entirely negative. In some cases, they may present opportunities for growth or development. For example, a new competitor entering the market may prompt a company to innovate and improve its products or services to remain competitive.

How to Do a SWOT Analysis

As shown above, SWOT analysis can be a powerful tool. Here’s a step-by-step guide on how to perform a SWOT analysis.

Step 1 – Define the objective: Determine the purpose of the analysis and what you hope to achieve. This will help guide your approach.

Step 2 – Gather information: Collect data on the company’s strengths, weaknesses, opportunities, and threats. This may involve conducting market research, reviewing financial statements, or surveying employees.

Step 3 – Identify strengths: Determine what the company does well and what sets it apart from the competition. Consider factors such as the company’s reputation, brand recognition, and unique selling proposition.

Step 4 – Identify weaknesses: Determine what the company needs to improve on and where it may be falling behind the competition. Consider factors such as financial stability, employee turnover, and customer satisfaction.

Step 5 – Identify opportunities: Determine external factors that could benefit the company, such as emerging markets, changes in customer behavior, or advancements in technology.

Step 6 – Identify threats: Determine external factors that could harm the company, such as new competitors, changing regulations, or economic downturns.

Step 7 – Analyze the results: Review the data collected and identify patterns or trends. This will help you identify the most important factors and prioritize them for action.

Step 8 – Develop an action plan: Use the insights gained from the analysis to develop an action plan that addresses the identified issues. This may involve developing new products or services, improving internal processes, or investing in new technology.

Step 9 – Monitor and adjust: Regularly review and adjust the action plan as needed to ensure it remains relevant and effective.

By following these steps, businesses can use SWOT analysis to gain a deeper understanding of their market positions.

SWOT Analysis Example: Amazon

Now that we understand what SWOT is and the steps to perform it, let’s take a look at a SWOT analysis example. We’ll use Amazon for our example.

Strengths:

  • Dominant market position in e-commerce and cloud computing.
  • Strong brand recognition and customer loyalty.
  • Diverse product and service offerings, including Amazon Prime, Alexa, and Amazon Web Services.
  • Advanced logistics and supply chain management capabilities.

Weaknesses:

  • Dependence on third-party sellers for a significant portion of sales.
  • “Too big”; antitrust concerns in some markets.
  • Known to compete against its own customers.
  • Increasing competition from other e-commerce and cloud computing companies.

Opportunities:

  • Growing demand for online shopping and cloud computing services.
  • Expansion into new markets, particularly in emerging economies.
  • Investment in emerging technologies such as artificial intelligence and drone delivery.
  • Diversification into new industries, such as healthcare and entertainment.

Threats:

  • Intense competition from other e-commerce and cloud computing companies.
  • Increasing regulatory scrutiny and potential changes in tax laws.
  • Economic downturns or shifts in consumer behavior that could impact sales.
  • Potential supply chain disruptions or cybersecurity threats.

Amazon SWOT Analysis Example

As we can see from this SWOT analysis of Amazon, the company has a number of strengths that have contributed to its dominant market position, including strong brand recognition, diverse product offerings, and advanced logistics capabilities. However, the company also faces several weaknesses, such as dependence on third-party sellers and criticism of labor practices.

SWOT Analysis Advantages & Disadvantages

One of the advantages of SWOT analysis is its simplicity. The technique is easy to understand and can be used by individuals at all levels of an organization. It also allows companies to quickly identify areas of strength and weakness, providing a starting point for further analysis and action. SWOT analysis is also versatile and can be used for a variety of purposes, such as evaluating a product or service, assessing a competitor, or analyzing an industry.

However, there are also disadvantages to using SWOT analysis. One of the main limitations is its potential to oversimplify complex situations, failing to provide nuanced insights. Results may be influenced by personal biases or incomplete information, and the analysis may be limited in scope, failing to account for important factors. Furthermore, SWOT analysis does not prioritize or rank the identified factors, making it difficult to determine which issues are most important to address. Finally, it may not provide clear guidance on how to take action based on the analysis.

Despite these limitations, SWOT analysis remains a popular and valuable tool for companies seeking to evaluate their business environment and make strategic decisions. To make the most of SWOT analysis, companies should ensure they have a diverse team of stakeholders involved in the process and use it in conjunction with other analytical tools to gain a more complete understanding of their situation.

Learn Finance to Support SWOT Analysis

At Lumovest, we’re building the place where anyone can learn finance and investing in an affordable and easy-to-understand manner. Our courses are far more intuitive, visualized, logical and colloquial than your college professor-taught courses. Our courses are taught by Goldman Sachs investment banker who has worked on transactions worth over $50 billion. We designed our courses to prepare you to succeed in the world of high finance. You’ll learn how to conduct financial analysis exactly like how it’s done on Wall Street’s top firms. Upon completion of the courses, you will receive our Global Financial & Investment Analyst (GFIA) certification. You can sign up here.

Tell me about a recent M&A deal that you followed

By Investment Banking Interview Questions No Comments

The investment banking interview question we’re going to go over today is “Tell me about a recent M&A deal that you followed.” Here’s what you can say.

Interview Answer

“A recent M&A deal that I followed is Microsoft’s acquisition of Activision Blizzard for $69 billion in an all-cash transaction. Microsoft is paying $95 per share, which is about a 45% premium. I followed this deal because I’m very interested in technology, especially about the metaverse. 

Strategically, I think it makes a lot of sense. Microsoft is very strong in software but it lacks a gaming portfolio. Activision has some really big games, like “Warcraft” and “Call of Duty”. This will provide Microsoft with the building blocks it needs to build metaverse.

From a valuation perspective, I also think it’s very astute. Microsoft acquired Activision when it’s trading near a 52-week low. Even with the 45% premium, the transaction is only about 15x one-year forward EBITDA, which is actually a bit low compared to some of the other technology transactions.

So overall I thought this was a very smart deal for Microsoft.”

Additional Tip

That’s how you can structure your answer to this question: “Tell me about a recent M&A deal that you followed”. Here’s a very important tip. For this question, picking the right deal is as important as is how you structure your answer. Ideally, you should pick a deal done by the bank you’re interviewing with. And for those of you who are interviewing with a particular industry group, the deal you pick should be in that industry.

More IBD Interview Questions

What makes a great LBO candidate?

What are the exit strategies in an LBO?

Why would a company want to acquire another company?

Testing

By Capital Structure, M&A, Valuation No Comments

Impairment Charge is an expense that reflects a reduction in the carrying value of an asset on the Balance Sheet. The impairment occurs when the carrying value of a particular asset on the Balance Sheet exceeds its fair market value. While any asset can suffer impairment, the most commonly impaired assets are Inventory, PP&E, Intangible Assets and Goodwill.

Top Banks in China

By Careers No Comments

Overview of Top Banks in China

This article covers top banks in China in the context of the broader banking sector. If you’re looking for content specifically on investment banking in China, please refer to this article instead.

Banks in China are regulated under the “One Committee, One Bank, Two Commissions” framework. In Chinese, that’s known as 一委一行两会. The “One Committee” refers to the Financial Stability and Development Committee, housed under the State Council. The “One Bank” refers to the People’s Bank of China, or PBOC for short. PBOC is China’s central bank. Just like how the Federal Reserve sets the rules for banks in the United States, PBOC sets rules for banks in China.  The “Two Commissions” refer to China Banking and Insurance Regulatory Commission and the China Securities Regulatory Commission. Collectively, these four regulatory bodies are extremely powerful and keep the top banks in China healthy and growing.

List of Top Banks in China by Assets

As the world’s second largest economy (largest by GDP using purchase price parity), China has an enormous banking industry. Inside China, there are over 200 Chinese banks, each possessing assets of at least ¥50 billion. As we researched China’s banks, we discovered an interesting pattern. Western banks like to name their banks after founders’ names. Some examples include Wells Fargo and J.P. Morgan. By contrast, Chinese banks like to name their banks after certain industries and cities. Some examples are the Agricultural Bank of China, China Construction Bank Corporation, Bank of Beijing, and Bank of Nanjing. Nearly all the major cities has a bank named after it. This pattern could be due to the fact that many banks in China are state-owned and state-controlled. On the other hand, Western banks usually are not owned by the state.

Since this article is about banks that accept deposits, we rank the top banks in China by their assets. This is different from investment banks, which the industry ranks based on M&A or capital markets volume. Interestingly, when we look at the banks this way, the top banks in China are also the top banks in the world. Today, China’s ICBC, CCB, ABC and BOC are the four largest banks in the world.

People's Bank of China PBOC

0. People’s Bank of China

People’s Bank of China (PBOC) is the central bank of China. PBOC is not technically part of the ranking of the top banks in China by assets. However, we feel this article cannot be complete without mentioning PBOC. That’s because PBOC is by far the most powerful banking institution in China. If you have an opportunity to work at PBOC, we encourage you to seriously consider it.

1. Industrial and Commercial Bank of China

ICBC is the abbreviated name of the Industrial and Commercial Bank of China. Founded on January 1st, 1984, ICBC is a state-owned commercial bank. The Ministry of Finance of China provided ICBC with capital. The bank’s Tier 1 Capital in 2013 was the largest of one thousand global banks. It’s the first Chinese bank in modern history to achieve this distinction. In 2006, Goldman Sachs purchased a 5.75% stake in ICBC just before ICBC’s IPO for US$2.6 billion. At the time, it was the largest equity check Goldman Sachs has ever invested.

2. China Construction Bank Corporation

CCB is the abbreviated name of the China Construction Bank Corporation. Founded on October 1st, 1954, CBB quickly grew to prominence. In 2015, CCB became the 2nd largest bank in the world and 6th largest company in the world by market capitalization. In 2005, Bank of America purchased approximately ~9% stake in China Construction Bank for US$3 billion. At the time, this investment was Bank of America’s largest investment into China’s growing banking sector.

3. Agricultural Bank of China

ABC or AgBank is the abbreviated name of the Agricultural Bank of China. Founded on July 10th, 1951, ABC has branches throughout China and expanded to broader Asia, Europe and North America. It’s headquarters is in Beijing. ABC has more than 320 million retail customers, 2.7 million corporate clients, and nearly 24,000 branches. It is China’s third largest lender by assets. Due to its enormous size, the Financial Stability Board classifies ABC as a systematically important bank.

4. Bank of China

BOC is the abbreviated name of the Bank of China. Founded in 1912, BOC is the second oldest bank in China. Like many other top banks in China, BOC’s headquarter is in Beijing. The Bank of China’s history began in 1905, when the Qing Dynasty established Daqing Hubu Bank in Beijing. In 1908, Qing Dynasty renamed it to Daqing Bank. When the Republic of China was established in 1912, the government transformed it into the Bank of China. As a result, BOC has a very rich history among the top banks in China. BOC is one of the world’s largest lenders and largest companies by market capitalization. The Financial Stability Board classifies BOC as a systematically important bank.

5. Postal Savings Bank of China

PSBC is the abbreviated name of the Postal Savings Bank of China. Founded on March 6th, 2007, PSBC provides basic financial services, especially to small and medium enterprises, rural residents and low income customers. It’s called “Postal” because the State Post Bureau provided PSBC with an initial capital of RMB20 billion in 2007. Today, PSBC has trillions of dollars in assets and possesses second largest number of branches, after the Agricultural Bank of China. Prior to its IPO in 2016, PSBC was the largest unlisted Chinese bank.

6. Bank of Communications

BOCOM is the abbreviated name of the Bank of Communications. Founded in 1908, BOCOM is the oldest bank in China. Fortune magazine ranked Bank of Communications No.151 among Global 500. The London-based The Banker magazine ranks it in top 1,000 banks in terms of Tier 1 Capital. During the 2000s, established western banks were making strategic investments into the Chinese banking sector. In BOCOM’s case, that strategic investor was HSBC. In 2004, HSBC agreed to purchase 19.9% of BOCOM for US$1.75 billion.

7. China Merchants Bank

CMB is the abbreviated name of the China Merchants Bank. Founded in 1987, CMB is one of China’s most recognizable banks. Most civilians recognize the CMB brand. In 2021, the Fortune magazine ranked CMB in No. 162 among the Global 500 and No. 37 among the China 500 lists. The Banker magazine ranked CMB in No. 14 among the top 1000 banks by Tier 1 Capital. CMB has thousands of branches worldwide, most of which are located inside China.

8. Industrial Bank

IB is the abbreviated name of the Industrial Bank. Industrial Bank is a top bank in China headquartered in Fuzhou. Founded on August 26th, 1988, the bank provides a wide range of financial services for consumers, businesses and other institutions. It is a public company, trading on the Shanghai Stock Exchange. In recent years, Industrial Bank has been expanding beyond its commercial banking roots into the investment banking space.

9. Shanghai Pudong Development Bank

SPDB or Pufa is the abbreviated name of the Shanghai Pudong Development Bank. Founded on January 9th, 1993, SPDB is a leading commercial bank headquartered in Shanghai. SPDB’s mission is to provide financial services for the development of Pudong New Area. This is a critical step in accomplishing the government’s objective of building Shanghai into a major international financial hub. Just as other western banks invested in Chinese banks in the early 200s, Citigroup invested in SPDB.

10. China CITIC Bank Corporation

China established China CITIC Bank Corporation in 1987. It is the first commercial bank in China to participate in financing in domestic and foreign financial markets. In April 2007, the bank achieved simultaneous listing of A shares on the Shanghai Stock Exchange and the H shares on the Hong Kong Stock Exchange. The bank possesses over a thousand outlets serving over a hundred cities.

11. China Minsheng Banking Corp.

CMBC is the abbreviated name of the China Minsheng Banking Corp. Founded on January 12, 1996, CMBC is the first bank in China to be majority-owned by the private sector. CMBC strategically positions itself to focus on making loans to small and medium enterprises. In 2000, CMBC went public on the Shanghai Stock Exchange. Subsequently, in November 2009, CMBC went public and listed on the Hong Kong Stock Exchange. As of today, China Minsheng Bank has nearly 3,000 banking outlets and over 57,000 employees.

12. China Everbright Bank Company

CEB is the abbreviated name of the China Everbright Bank Company. Founded in August 1992, CEB is a leading Chinese commercial bank headquartered in Beijing. CEB is listed on both the Shanghai Stock Exchange (August 2010) and the Hong Kong Stock Exchange (December 2013).

13. Ping An Bank

Founded on June 22nd, 1995, Ping An Bank is a leading Chinese bank headquartered in Shenzhen. Ping An Bank is a subsidiary of Ping An Group. The Ping An Group has three main business lines: insurance, banking, and asset management. The bank represents the parent company’s foray into the banking sector. Ping An Bank is listed on the Shenzhen Stock Exchange.

14. Huaxia Bank

HXB is the abbreviated name of the Huaxia Bank. Founded in 1992, HXB is the fifth bank in China to go public on the Shanghai Stock Exchange. Similar to its peers who accepted strategic investments from western banks, HXB arranged a strategic investment from Deutsche Bank. The firm has a major focus financing the projects of low-income housing construction and urban-rural integration. It offers a substantial portion of its loans to serve “Agriculture, Rural Areas and Farmers”. It has established significant outlets in Chinese villages and rural counties.

15. Bank of Beijing

BOB is the abbreviated name of the Bank of Beijing. Founded in January 1996, the bank is a public company listed on the Shanghai Stock Exchange. According to the company, despite having most of its branches outside of Beijing, BOB derives a substantial portion of its revenue solely from Beijing. In 2005, the Dutch financial group ING became a strategic investor and purchased 19.9% of BOB. The Beijing government is also a major shareholder in the company.

16. China Guangfa Bank

China Guangfa Bank was originally name Guangdong Development Bank. Guangfa is an abbreviation of Guangdong Development just as Pufa is an abbreviation of Shanghai Development. CGB is a further abbreviation of the bank’s name. Founded in 1988, the bank focuses its operations in Guangdong, Hong Kong and Macau. It has also been expanding beyond these regions.

17. Bank of Shanghai

BOSC is the abbreviated name of the Bank of Shanghai. Founded on December 29th, 1995, the bank is named after and headquartered in Shanghai city. It is a public company listed on the Shanghai Stock Exchange. In the early 2000s, BOSC received strategic investments from the International Finance Corporation and the World Bank. Despite its name, BOSC has expanded far beyond Shanghai into southern, western and central China. As of today, Bank of Shanghai is one of China’s largest banks by assets.

18. Bank of Jiangsu

Compared to other top banks in China, Bank of Jiangsu is relatively young. Founded in January 2007, the bank quickly grew to become one of China’s largest banks in merely a decade. The bank is a public company, trading on the Shanghai Stock Exchange. Named after Jiangsu province, the bank has presence in all counties inside the province. Similar to other banks named after cities and provinces, the bank has expanded beyond its namesake place. It focuses on three main economic regions: Yangtze River Delta, Pearl River Delta, and the Bohai Rim.

19. China Zheshang Bank

CZB is the abbreviated name of the China Zheshang Bank. Founded in 2004, CZB has its headquarters in Hangzhou. The “Zhe” in its name is an abbreviation for the Zhejiang province. As implied by the bank’s name, the bank has a stronghold in Zhejiang province. It is a public company trading on both the Shanghai Stock Exchange and the Hong Kong Stock Exchange.

20. Bank of Nanjing

NJCB and BoN are the abbreviated names of the Bank of Nanjing. Founded in 1996, BoN is one of the top banks in China. BoN focuses on providing banking services for medium-sized enterprises and small businesses, totaling over 100,000 corporate clients. The bank has also a large individual client base, totaling over 2 million individual clients. It can offer all kinds of banking products, including loans, wealth management products, credit cards, etc.

Other Top Banks in China

Because China has a huge economy, even banks outside of the top 20 are very big by international standards. Here, we list the other top banks in China by assets beyond the ones we described above. We show the top 90 banks in the picture below. You can download the full list of the 120 top banks in China by assets here.

Ranking of Top Banks in China

Trends Among the Top Banks in China

The banking industry in China is constantly evolving due to the large market potential and the intense competition. There are three main trends among the top banks in China.

First, after years of deliberation, the Chinese government allowed banks to establish wealth management subsidiaries. This approval meant that banks can expand beyond banking products (i.e. deposits, cards, currencies, loans) into wealth management services. After this approval, CCB (China Construction Bank) became the first bank to establish a wealth management business. We are still in the early innings of this trend. Over the coming decade, we expect more and more of the top banks in China to expand into wealth management.

Second, there is increasingly stricter regulation to prevent banks from becoming “too big to fail”. In the recent years, there were several instances of banks in China running into trouble. As a result, the PBOC and the CBIRC had deliberated on rules to impose on systematically important banks. Regulations will continue to tighten in the coming years to curtail excessive risk to the country’s economy.

And finally, China is launching its own digital currency, the Digital Yuan or the e-CNY. This will materially transform money as people in China knows it. In the coming decade, Chinese banks will adjust their product offerings to better align with this new digital currency.

How Lumovest can Prepare You for a Career with Top Banks in China

Lumovest is one of the world’s leading education providers. We teach you how to analyze financials and investments from the grounds up. Our curriculum is based on how things are done at the top banks and the top investment firms. As a result, our courses are very practical and very relevant to what you’ll do on a day-to-day basis.

Developing a strong financial analytical skillset will help you stand out during the hiring process in China. Through our courses, you’ll learn accounting, financial modeling, LBO, DCF, M&A and valuation. At the end, you’ll receive an official blockchain-verified digital certification, which you can showcase on your resume. You can sign up here.

Top Banks in Hong Kong

By Careers No Comments

In this article, we’ll take a look at the top banks in Hong Kong. It’s important to note that when we say banks in this article, we’re referring to all institutions that accept deposits. This includes both retail banks & investment banks. If you’re looking for an article specifically on the investment banks in Hong Kong, please refer to our other article covering investment banking in Hong Kong.

As one of the world’s top three international financial centers, Hong Kong has a thriving banking industry. The Hong Kong Monetary Authority (HKMA) regulates the banking sector in Hong Kong. As an indicator of how powerful and important HKMA is, the agency occupies the top floor of Two IFC. Two IFC is one of the most iconic buildings in Hong Kong. If you search for Hong Kong’s skyline, chances are the pictures will feature Two IFC. Along with ICC, Two IFC is one of the most prestigious office buildings in Hong Kong. Two IFC has one major advantage over ICC in that Two IFC is in Central whereas ICC is in Kowloon. Two IFC’s tenants include titans of Wall Street, such as UBS, Baring Private Equity Asia, ADIA, and Millennium Management. HKMA, a government agency, occupies the penthouse floor of what is arguably the city’s most iconic skyscraper.

Top Banks in Hong Kong Two IFC

Banking System in Hong Kong

The HKMA regulates the Hong Kong banking through a three-tier system. Specifically, the system classifies banks into three tiers based on (i) deposit amount, (ii) deposit term and (iii) business nature. The three tiers are Licensed Banks, Deposit-Taking Companies, and Restricted License Banks. These three tiers of banks are collectively known as “Authorized Institutions” or “AI” for short under the Banking Ordinance. For American readers, “Ordinance” is just a British English word for law. Due to Hong Kong’s colonial history, the city uses British English terms, such as “Ordinance” instead of American English terms, such as naming laws with “Act” or “Bill”.

Licensed Banks can accept deposits of any size and maturity from the public. Licensed Banks can be incorporated inside or outside Hong Kong.

Deposit-Taking Companies can only accept deposits of HK$100,000 or above and maturity of at least 3 months. Deposit-Taking Companies must be incorporated in Hong Kong.

Restricted License Banks can only accept deposits of HK$500,000 and above. Restricted License Banks can be incorporated inside or outside Hong Kong.

This license classification matters more from a commercial perspective. If you’re studying the HK banking landscape, you can visit here for a detailed breakdown of banks by license.

However, if you’re a job candidate, we recommend you also look at banks from two other perspectives. First, consider the bank’s nature of business (i.e. M&A, capital markets, loans, etc). The nature of the bank’s business affects what you’ll do on a day-to-day basis. Second, consider the bank’s size. In general, larger banks have more resources and greater brand reputation. In the next section, we’ll list out the top banks in Hong Kong by license type and by assets. Many of these banks have both retail and investment banking business activities.

Top Banks in Hong Kong

Here’s our list of the top banks. We categorize it by license type and then reference their reported total amount of assets. Since this article is about banks that accept deposits, we rank the banks by assets. This is different from investment banks, which we’d rank based on M&A or capital markets volume.

Licensed Banks

1. HSBC

HSBC is the largest bank in Hong Kong and operates throughout the Asia Pacific region and in other countries around the world.

Total Assets: HK$9,416 billion

2. Bank of China (Hong Kong)

The Bank of China is the fourth largest bank in the world.

Total Assets: HK$3,145 billion

3. Standard Chartered

Standard Chartered was founded in 1859 and is one of the most recognized banks in Hong Kong.

Total Assets: HK$2,457 billion

4. Hang Seng Bank

Hang Seng Bank is a Hong Kong-based banking and financial services company headquartered in Central, Hong Kong.

Total Assets: HK$1,760 billion

5. ICBC (Industrial and Commercial Bank of China)

Founded as a limited company on 1 January 1984, ICBC is a Chinese state-owned bank.

Total Assets: HK$931 billion

6. BEA (Bank of East Asia)

BEA is currently the largest independent local Hong Kong bank. It’s also one of two remaining family-run Hong Kong banks (the other being Dah Sing Bank).

Total Assets: HK$884 billion

7. Nanyang Commercial Bank

Established in 1949, NCB is a Hong Kong bank that focuses primarily on corporate customers.

Total Assets: HK$506 billion

8. DBS Bank

DBS Bank is a Singaporean bank with operations in Hong Kong.

Total Assets: HK$484 billion

9. China Construction Bank

China Construction Bank Corporation is one of the “big four” banks in the People’s Republic of China.

Total Assets: HK$475 billion

10. China CITIC Bank International

Founded in 1922, China CITIC Bank International is a full-service commercial bank in Hong Kong.

Total Assets: HK$393 billion


Deposit-Taking Companies

1. Public Finance

Public Finance is one of the largest financial institutions in Hong Kong. It has a total of 43 branches located in Hong Kong Island, Kowloon and the New Territories.

Total Assets: HK$7 billion

2. Kexim Asia

Kexim Asia is a subsidiary of The Export-Import Bank of Korea.

Total Assets: HK$4 billion

3. Woori Global Markets Asia

Woori Global Markets Asia is a 100% Hong Kong subsidiary of Woori Bank.

Total Assets: HK$3 billion

4. KEB Hana Global Finance

KEB Hana Global Finance provides investment banking, corporate finance, structured finance, underwriting, principal investment and other related services

Total Assets: HK$1 billion

5. BPI International Finance

BPI International Finance Limited is a wholly-owned subsidiary of the Bank of the Philippine Islands incorporated in Hong Kong.

Total Assets: HK$0.4 billion

6. Vietnam Finance Company

See here for more detailed information about this company.

Total Assets: HK$0.4 billion

7. Commonwealth Finance Corporation

CFCL primarily extends working capital finance to Asia Pacific companies who are involved in import/export, manufacturing, wholesale and retail businesses.

Total Assets: HK$0.3 billion

8. Corporate Finance (D.T.C.)

Established in 1982, this company also provides mortgage lending, share margin financing and commercial loans in addition to deposit taking.

Total Assets: HK$0.3 billion

9. BCOM Finance

This is a subsidiary of the Bank of Communications.

Total Assets: HK$0.3 billion

10. Fubon Credit

Fubon is one of Taiwan’s largest financial holding companies and has operations in Hong Kong.

Total Assets: HK$0.1 billion


Restricted License Banks

1. Bank of Shanghai

As the name suggests, the Bank of Shanghai is a bank based in Shanghai.

Total Assets: HK$39 billion

2. Kasikornbank Public Company

Kasikornbank, often shortened as KBank (and formerly known as the Thai Farmers Bank) is a Thailand banking company.

Total Assets: HK$20 billion

3. KDB Asia Limited

KDB Asia Limited is a wholly-owned subsidiary of KDB Bank in January 1986.

Total Assets: HK$19 billion

4. Siam Commercial Bank

Siam Commercial Bank is a Thai bank founded in 1907.

Total Assets: HK$16 billion

5. J.P. Morgan Securities Asia

J.P. Morgan Securities Asia was founded in 1971 and its principal line of business is the brokerage of securities.

Total Assets: HK$15 billion

6. Bank of China

The Bank of China is the fourth largest bank in the world.

Total Assets: HK$9 billion

7. Citicorp International

This is a subsidiary of Citigroup, one of America’s premier banks.

Total Assets: HK$8 billion

8. ORIX Asia Limited

ORIX Asia Limited provides equipment finance, cross-border leasing, corporation finance, vehicle finance, professional finance, and mortgage loan for properties.

Total Assets: HK$5 billion

9. Banc of America Securities Asia

This is the Hong Kong subsidiary of Bank of America.

Total Assets: HK$4 billion

10. Scotiabank

The Bank of Nova Scotia, operating as Scotiabank, is a Canadian multinational banking and financial services.

Total Assets: HK$3 billion


Preparing for a Job at Top Banks in Hong Kong

To get a job at a top bank in Hong Kong, you should possess strong analytical and financial modeling skills. Lumovest’s courses are taught by former Goldman Sachs investment banker. Our curriculum teaches you how to conduct analysis like how it’s done on at the top banks. Notably, we include great visuals and worksheets to make things easy to follow and understand. After the end of the program, you’ll also receive our professional GFIA certification. You can sign up here.

Top Banks in Malaysia

By Careers No Comments

Overview of Top Banks in Malaysia

In this article, we’ll take a look at the top banks in Malaysia. Because Malaysia has one of Southeast Asia’s most advanced economies, these banks are not only the best banks in Malaysia, but also the cream of the crop in the region. This list of top banks in Malaysia is a helpful guide on where to start for anyone considering a banking career in Malaysia.

The banks in Malaysia are governed by the Bank of Bank Negara Malaysia, which is the country’s central bank. The central bank extends five different types of banking licenses. They are Commercial Banks, Islamic Banks, International Islamic Banks, Investment Banks, and Other Financial Institutions. A company can hold multiple licenses. You can find a detailed breakdown of list of banks with licenses here.

top banks in Malaysia

List of Top Banks in Malaysia

As you’ll see, all of the best banks in Malaysia have their headquarters in Kuala Lumpur or “KL” for short. Kuala Lumpur is not only Malaysia’s capital, it’s also the country’s most important financial center. It’s about 4 hours of drive from Singapore, which is an even larger financial center in Asia Pacific.

1. Maybank

Malayan Banking Berhad or Maybank is a Malaysian universal bank. It provides both retail (consumer) banking and investment banking services. The firm is Malaysia’s largest bank by total assets and by market capitalization. Founded in 1960 by a Singaporean businessman, Maybank quickly rose to prominence in the country’s banking scene. It provides a wide range of financial services through an extensive network of branches across Southeast Asia. Globally, it has three key markets: Malaysia, Singapore, and Indonesia. Though Maybank has presence in many countries, these three markets are the key strategic strongholds for the bank. Maybank has the most recognizable brand among all the banks in Malaysia. It’s a public company trading on the Bursa Malaysia (Malaysia’s stock exchange). Maybank’s headquarters is in Kuala Lumpur.

2. CIMB Group

CIMB Group Holdings Berhad or CIMB Group is a Malaysian universal bank. The firm offers consumer banking, commercial banking, investment banking, Islamic banking, and asset management services. Consumer banking (retail banking) serves individual customers. Commercial banking serves small and medium businesses. Investment banking serves corporate clients. And finally, its Islamic banking services provide Shariah-compliant financial solution. CIMB is the second largest bank in Malaysia and the fifth largest in ASEAN (Association of Southeast Asian Nations). The bank is the result of a series of corporate mergers among leading banks in Southeast Asia. It’s a public company trading on the Bursa Malaysia. CIMB’s headquarters is in Kuala Lumpur.

3. Public Bank

Public Bank Berhad or Public Bank is the third largest bank in Malaysia by total assets. The company has hundreds of branches across Malaysia, Hong Kong, Mainland China, Cambodia, Vietnam, Laos, and Sri Lanka. Whereas other major Malaysian banks focused on Singapore and Indonesia, Public Bank prioritized the aforementioned markets. Outside of Malaysia, Hong Kong is the bank’s most important market, followed by Cambodia. Founded in 1966, Public Bank quickly grew to become one of the country’s most valuable companies. It’s a public company trading on the Bursa Malaysia. Public Bank’s headquarters is in Kuala Lumpur.

4. RHB Bank

RHB Bank is the fourth largest bank in Malaysia by total assets. Similar to many of its peers, RHB offers consumer banking and investment banking services to its clients. The company acquired OSK Investment Bank and this transaction made RHB’s investment banking unit one of the country’s largest. As one of the first banks to receive an Islamic banking license, it offers a range of Shariah-compliant banking services. It’s a public company trading on the Bursa Malaysia. RHB Bank’s headquarters is in Kuala Lumpur.

5. Hong Leong Bank

Hong Leong Bank began its operations in 1905 as a company that processed loans and remittances for Chinese in Malaysia. Over the last century, it grew to become one of the top banks in Malaysia. Hong Leong Bank is the banking subsidiary of the parent company Hong Leong Group. The parent company is a financial services conglomerate operating in banking, insurance, and securities. Hong Leong Bank is a public company trading on the Bursa Malaysia and its headquarters is in Kuala Lumpur.

6. AmBank

AmBank or AMMB Holdings is one of the top banks in Malaysia. Its core businesses are retail banking, wholesale banking, Islamic banking, and insurance. Founded in 1975, the founder originally named the bank “Persian – Malaysian Development Bank”. As the name indicates, the bank has significant cultural and business ties to the Arab community. By contrast, some of its competitors such as Hong Leong and UOB focuses on the Chinese community. It has hundreds of branches and ATM terminals throughout the country. AmBank is a public company trading on the Bursa Malaysia and its headquarters is in Kuala Lumpur.

7. UOB (Malaysia)

UOB stands for United Overseas Bank. It’s a Singaporean bank with significant presence in Malaysia. Due to Singapore and Malaysia’s geographic proximity, there’s significant commercial overlap between the two countries. Many Malaysian banks operate in Singapore and similarly, some Singaporean banks are among the best banks in Malaysia. The company’s Malaysia operations began in 1951 and has since grew to become one of the top banks in Malaysia. The Ratings Agency Malaysia (RMB) gave the bank a long-term ‘AAA’ rating. UOB has a very strong brand name not only in Malaysia but also in ASEAN. UOB Malaysia’s headquarters is in Kuala Lumpur.

8. Bank Rakyat

Bank Rakyat is the largest Islamic cooperative bank in Malaysia. Founded in 1954, the bank originally follows a conventional banking system. Then, in 2002, it changed into a banking system based on Syariah. This transformation enabled the company to record encouraging profits year after year. It provides consumer banking, commercial financing, and investment services. Bank Rakyat’s headquarters is in Kuala Lumpur.

9. OCBC Bank (Malaysia)

OCBC stands for Overseas-Chinese Banking Corporation. It is a major Singaporean bank whose operations in the neighboring country puts it among the best banks in Malaysia. The company provides retail / consumer banking, corporate banking and investment banking services for its clients. In addition, it also provides Islamic banking under a license from the country’s government. OCBC Malaysia’s headquarters is in Kuala Lumpur.

10. HSBC Bank (Malaysia)

HSBC Bank Malaysia Berhad is one of the best banks in Malaysia. It’s a subsidiary of the HSBC Group and employs about 4,000 people in the country. The company has one of the longest lasting presence in Malaysia among all the banks. HSBC established its first office in the country in 1884. It offers retail / consumer banking for individuals, corporate banking for businesses, and investment banking services. Due to HSBC’s large scale and resources, HSBC Malaysia is a pioneer in many ways. For example, it introduced the nation’s first ATM machine and digital accounting opening. HSBC Malaysia’s headquarters is in Kuala Lumpur.

Other Top Banks in Malaysia

The above are the top 10 banks in Malaysia. However, they’re far from the only banks in the country. The Malaysian economy is very big and it has one of the most robust banking industries in Southeast Asia. Other top banks in Malaysia are: BIMB Holdings, Affin Bank, Alliance Bank, Standard Chartered, MBSB Bank, and Bank Simpanan Nasional. Citibank also has big operations in the country.

Preparing for a Career with Top Banks in Malaysia

Lumovest is one of the world’s leading education providers. We teach you how to analyze financials and investments from the grounds up. Our curriculum is based on how things are done at the top banks and the top investment firms. As a result, our courses are very practical and very relevant to what you’ll do on a day-to-day basis.

Developing a strong financial analytical skillset will help you stand out during the hiring process in China. Through our courses, you’ll learn accounting, financial modeling, LBO, DCF, M&A and valuation. At the end, you’ll receive an official blockchain-verified digital certification, which you can showcase on your resume. You can sign up here.

Related Readings

Top Banks in Hong Kong

Top Banks in Taiwan

Top Banks in Singapore

By Careers No Comments

In this article, we’ll take a look at the top banks in Singapore. As one of the world’s wealthiest countries, Singapore has a buzzling banking industry. The Singapore banking industry has a total asset size of approximately US$2 trillion and growing by the day. Since Singapore is a major international financial hub, its banking industry is critical to financing Southeast Asia’s trade and development. In fact, Singapore’s banking sector is a rising competitor to that of Hong Kong.

A set of five laws govern Singapore’s banking industry. They are the Banking Act, the Monetary Authority of Singapore Act, Anti-Money Laundering Regulations, Payment & Settlement Systems Guidelines, and the Securities and Futures Act. The Monetary Authority of Singapore (MAS) enforces these laws and regulates over 150 banks (also known as “Deposit-Taking Institutions”) in Singapore. Singapore has four main local banks along with many foreign banks.

The Different Types of Top Banks in Singapore

There are nine types of bank licenses in Singapore. These licenses are Local Bank, Full Bank, Qualifying Full Bank, Wholesale Bank, Merchant Bank, Representative Office, Finance Company, Money Broker, and Financial Holding Company. The first six types of banks represent over 95% of banking registrations in Singapore.

Local Banks benefit from a series of advantages allowing them to dominate Singapore’s banking sector. This should make natural sense. No country would want to let foreign banks dominate its banking sector. There are four companies under the Local Bank category. They are the Bank of Singapore, DBS Bank, OCBC, and UOB. OCBC owns Bank of Singapore.

Full Banks conduct a whole range of banking business for retail and corporate clients. Foreign banks enjoy less flexibility than their local counterparts in their branch and ATM networks.

Qualifying Full Banks are similar to Full Banks. However, it comes with greater flexibility to serve Singapore retail customers. Therefore, foreign banks would usually get two licenses. They would register their foreign parent company as a Full Bank and their Singapore subsidiary as a Qualifying Full Bank. For example, Citibank Singapore Limited is registered as a Qualifying Full Bank. Citibank N.A. (parent company of Citibank Singapore Limited) is registered as a Full Bank.

Wholesale Banks engage in the same range of banking business as Full Banks except that they do not carry out Singapore Dollar retail banking activities.

Merchant Banks provide corporate finance, underwriting of securities issuances, mergers and acquisitions, investment management, consulting services, and other fee-based activities. This is different from American definition of merchant banking, which usually means private equity investing using the banks’ money.

A bank Representative Office may carry out liaison work and market research only. They are not allowed to provide any actual banking or securities services in Singapore.

Top Banks in Singapore

List of Top Banks in Singapore

Since this article is about banks that accept deposits, we rank the top banks in Singapore by their assets and general retail presence. This is different from investment banks, which the industry ranks based on M&A or capital markets volume. Unsurprisingly, the top banks in Singapore are the Singaporean banks. DBS, OCBC and UOB dominate the city-state’s banking scene. These are the big three native Singaporean banks. The rest of the market is primarily occupied by foreign banks.

DBS Bank

Formerly known as the Development Bank of Singapore, DBS Bank is the Singapore banking industry’s market leader. The Singapore government established DBS in 1968 to facilitate the country’s economic expansion. The idea was to have a bank that can handle foreign investments and provide financing to commercial projects. As Singapore became one of the world’s wealthiest countries, DBS quickly ascended to become one of Asia’s top banks. DBS’s headquarters is in the Marina Bay district and trades on the Singapore Exchange. Along with OCBC and UOB, DBS is one of the three mega banks in Singapore.

OCBC Bank

OCBC is the abbreviated name for the Oversea-Chinese Banking Corporation. In 1932, three banks (Chinese Commercial Bank, Ho Hong Bank, and Overseas-Chinese Bank) merged together to form OCBC. In the years thereafter, as Singapore’s economy expanded, the bank quickly grew to become one of Southeast Asia’s largest banks. OCBC’s headquarters is near the Singapore River and trades on the Singapore Exchange. Along with DBS and UOB, OCBC is one of the three mega banks in Singapore. OCBC also owns Bank of Singapore. Hence, we’re not breaking the Bank of Singapore out on its own here because it belongs to OCBC.

UOB

UOB is the abbreviated name for the United Overseas Bank. It is not only one of the largest banks in Singapore, but is also the third largest bank in Southeast Asia by total assets. Founded in 1935 as the United Chinese Bank, the firm changed its name to United Overseas Bank in 1965. UOB is headquartered in Singapore’s Central Business District and trades on the Singapore Exchange. Along with DBS and OCBC, UOB is one of the three mega banks in Singapore.

Standard Chartered (Singapore)

SC is the abbreviated name for Standard Chartered. Standard Chartered has a long history of over 160 years in Singapore. SC where opened its first branch in Singapore in 1859. The bank operates in SG under a Qualifying Full Bank (QFB) license. It offers a full range of banking services across personal, priority and private banking. In addition, it also provides business clients corporate, commercial & investment banking services.

Citibank (Singapore)

Citibank Singapore Limited is the Singapore subsidiary of the American global bank Citibank, which is itself a subsidiary of Citigroup. The firm first entered the Singapore market in 1902 under the name International Banking Corporation (IBC). It was the first American bank to set up a branch in Singapore. The company then received the Qualifying Full Bank (QFB) license in 1999. Citibank is headquartered in Asia Square. The firm is a pioneer in the Singapore banking sector in many ways. For example, Citibank was the first to popularize the use of ATM machines in the country. It was also the first to popularize telephone banking service.

Maybank (Singapore)

Maybank is one of Malaysia’s largest banks. Because Singapore is located right next to Malaysia, the two country have significant population and business interactions. Maybank is among Asia’s leading banking groups and is Southeast Asia’s fourth largest bank by assets. Maybank Group has an international network of approximately three thousand branches and serves all 10 ASEAN countries. Singapore is one of Maybank’s largest markets outside of Malaysia. Maybank entered Singapore in 1960 and currently operates in Singapore under the Qualifying Full Bank (QFB) license.

HSBC (Singapore)

HSBC is the abbreviated name for the Hongkong Shanghai Banking Corporation. The bank first entered the Singapore market in 1877 when it opened its first branch in the country. For more than 140 years, HSBC Singapore kept its headquarters in Collyer Quay. In 2020, HSBC moved to the Marina Bay Financial Centre. HSBC in Singapore offers a comprehensive range of banking and financial services including retail banking and wealth management; commercial, investment and private banking; insurance; forfaiting and trustee services; securities and capital markets services.

SBI (Singapore)

SBI Singapore is the Singapore subsidiary of the State Bank of India. State Bank of India is a “Public Sector Undertaking” (PSU) type of company. This means that as its name implies, the Indian government owns the State Bank of India. It is India’s largest bank, controlling over a quarter of the market. Because Singapore has many Indian migrants, SBI is able to benefit significantly from its brand recognition. SBI Singapore was established in 1977 and currently operates in the country under the Qualifying Full Bank (QFB) license.

Bank of China (Singapore)

Established in 1936, Bank of China Singapore Branch holds the Qualifying Full Bank License (QFB) in Singapore. Because the overwhelming majority of Singapore population is Chinese, Bank of China hold significant influence and recognition in the country. It has a network with over 20 financial touch points in the country. Bank of China Singapore provides clients with a full suite of banking services. These include Personal Banking, Corporate Banking, Treasury, and Investment Banking services.

RHB (Singapore)

RHB was established in Singapore in 1961 as UMBC Bank. After a series of corporate mergers and reorganizations, the firm now brands itself as RHB Singapore. RHB is a Malaysian bank. Similar to Maybank, RHB expanded to Singapore because of the country’s geographic and cultural proximity to Malaysia. RHB serves both retail and corporate customers. For retail customers, it offers Retail Banking and Wealth Management. For corporate customers, it offers Commercial Banking, Corporate Banking, Treasury, Structured Finance and Investment Banking services.

Preparing for a Career with the Top Banks in Singapore

Lumovest is one of the world’s leading education providers. We teach you how to analyze financials and investments from the grounds up. Our curriculum is based on how things are done at the top banks and the top investment firms. As a result, our courses are very practical and very relevant to what you’ll do on a day-to-day basis. The courses are taught by former Goldman Sachs investment banker.

Developing a strong financial analytical skillset will help you stand out during the hiring process in Singapore. Through our courses, you’ll learn accounting, financial modeling, LBO, DCF, M&A and valuation. At the end, you’ll receive an official blockchain-verified digital certification, which you can showcase on your resume. You can sign up here.

Related Readings

This article focuses on the top banks in Singapore. However, there are many other places in Asia with tremendous banking industries. If you want to pursue a career in the banking industry, you can also check out some of the top banks in other parts of Asia.

Top Banks in Taiwan

By Careers No Comments

Overview of the Top Banks in Taiwan

As one of the world’s most advanced economies, the top banks in Taiwan have huge assets and strong capabilities. In this article, we’ll take a look at the ranking of the top banks in Taiwan. This list of top banks in Taiwan is a helpful guide for anyone pursuing a banking career in the region.

In Taiwan, the Central Bank of the Republic of China (Taiwan) and the Financial Supervisory Commission regulate the banking sector. There are tens of banks and thousands of branches spread across island.

Taipei Skyline

List of Top Banks in Taiwan

Since this article is about banks that accept deposits, we rank the top banks in Taiwan by their assets. This differs from investment banking, which the industry ranks based on M&A or capital raising volume. Taiwan has a limited investment banking scene. While there certainly exist investment banking activities in Taiwan, it’s relatively small compared to the volume in Hong Kong.

Unsurprisingly, the top banks in Taiwan are domestic companies. Postal Remittances and Savings Bank, Bank of Taiwan, CTBC Bank and the Taiwan Cooperative Bank lead the market. Among the top 16 banks in Taiwan, 15 banks are headquartered in Taipei. That shouldn’t be surprising because Taipei is the financial capital of Taiwan. Among all of Taiwan’s cities, Taipei has the most developed transportation infrastructure and most sophisticated financial network. Only 1 bank, the Chang Hwa Bank, is headquartered outside of Taipei.

1. Bank of Taiwan (臺灣銀行)

BOT is the abbreviated name for the Bank of Taiwan. BOT’s predecessor is the Bank of Taiwan Kabushiki-gaisha, which the Japanese established in 1899 during its ruling period. After Taiwan took back governance from Japan, the government changed the bank’s name to Bank of Taiwan. It is Taiwan’s first government-owned bank. As is the case with many other state-owned banks, BOT has the most amount of assets in the industry. It also has the widest presence across the island. Bank of Taiwan’s brand is widely recognized among the Taiwanese population. BOT’s headquarters is in Taipei.

2. CTBC Bank (中國信託商業銀行)

Established on March 14, 1966, CTBC Bank has been operating in Taiwan for over half a century. Over this period, CTBC has grown to become a major player offering a comprehensive suite of financial services. CTBC was the pioneer in Taiwan’s banking industry in many ways. It issued the first credit card and set up the first banking customer service center in Taiwan. It has a wide network of branches across Taiwan and overseas, including US, Canada, Philippines, and Indonesia. CTBC’s headquarters is in Taipei.

3. Taiwan Cooperative Bank (合作金庫銀行)

TCB is the abbreviated name for the Taiwan Cooperative Bank. The Japanese established the TCB in 1923 during its rule of Taiwan. Since its founding, TCB has grown to become of the top banks in Taiwan. It went public and currently trades on the Taiwan Stock Exchange. It has hundreds of branches spread across Taiwan and overseas. Taiwan Cooperative Bank’s headquarters is in Taipei.

4. Mega International Commercial Bank (兆豐國際商業銀行)

Mega ICBC is the abbreviated name for the Mega International Commercial Bank Company. It has a similar name as Mainland China’s ICBC, which is a top bank in China. Similar to other top banks in Taiwan, Mega ICBC has a rich history going back several decades. It’s a public company trading on the Taiwan Stock Exchange. Like many of its peers, Mega ICBC also established its headquarters in Taipei.

5. First Commercial Bank / First Bank (‎第一銀行)

First Commercial Bank (or First Bank) was originally established on November 12, 1899 as Savings Bank of Taiwan. Over the century, it pursued several M&A transactions. Consequently, it merged with Commercial and Industrial Bank of Taiwan, Chia-I Bank and Hsin-Kao Bank to become the First Bank as we know it today. It has hundreds of branches spread across Taiwan and overseas. In terms of total assets and Tier 1 Capital, First Commercial Bank is among the world’s top 250 banks. First Commercial Bank’s headquarters is in Taipei.

6. Taipei Fubon Commercial Bank (台北富邦商業銀行)

Founded in 2005, Taipei Fubon Commercial Bank is the surviving entity following the merger of Taipei Bank and Fubon Bank. It is the banking subsidiary of Fubon Financial parent company. Fubon Financial has a wide range of businesses in the financial services sector beyond just banking. The bank is one of the top companies in Taiwan but it’s merely a unit within the larger Fubon organization. It is aggressively expanding its operations overseas in Southeast Asia. Taipei Fubon Commercial Bank’s headquarters is in Taipei.

7. Cathay United Bank (國泰世華銀行)

In 2003, United World Chinese Commercial Bank merged with Cathay Commercial Bank to form the Cathay United Bank. The bank is aggressively expanding in Southeast Asia through a series of acquisitions. For example, it acquired Singapore Banking Corporation to tackle the Cambodia market. It acquired Bank of Nova Scotia Berhad Malaysia to tackle the Malaysia market. It is a public company trading on the Taiwan Stock Exchange. Cathay United Bank’s headquarters is in Taipei.

8. Land Bank of Taiwan (臺灣土地銀行)

LBOT is the abbreviated name of the Land Bank of Taiwan. As the name implies, it is a wholly state-owned bank specializing in real estate and agricultural financing. Following the end of World War II, the Taiwan government established LBOT in 1946 to implement its land policies. LBOT has limited presence outside of Taiwan. Most of its operations are within Taiwan. Land Bank of Taiwan’s headquarters is in Taipei.

9. Hua Nan Commercial Bank (華南銀行)

HNCB is the abbreviated name of the Hua Nan Commercial Bank. Founded in 1919, HNCB is among one of the oldest banks in Taiwan. The bank offers a wide range of financial services to individuals and institutions in Taiwan. Most of its business operations are within Taiwan. It does have some presence overseas, but those are very limited. HNCB’s headquarters is in Taipei.

10. E.SUN Commercial Bank (玉山商業銀行)

Contrary to what it might seem at first glance, E.SUN’s name does not mean “electronic sun” or “digital sun”. Rather, E.SUN is the English phonetic name of its Chinese name, which means “jade mountain”. Founded in 1992, E.SUN Bank quickly grew to become one of Taiwan’s largest banks. That’s partially because the bank is a subsidiary of the Taiwanese financial giant E.SUN Financial Holding Company. The parent company has operations across banking, securities, investing, and consulting. E.SUN Bank serves retail customers as well as large corporations. E.SUN Bank’s headquarters is in Taipei.

11. Chang Hwa Bank (彰化銀行)

CHB is the abbreviated name for the Chang Hwa Bank. The Japanese established the bank in 1905 and named it after Changhua County. It’s a public company trading on the Taiwan Stock Exchange. It’s also one of the few top banks in Taiwan to have its headquarters outside of Taipei. CHB’s headquarters is in Taichung.

12. Shanghai Commercial & Savings Bank (上海商業儲蓄銀行)

In 1915, Chen Guangfu founded the Shanghai Commercial & Savings Bank. At the time, the bank was operating in Shanghai and became one of Mainland China’s top private banks. Following the defeat of the Chinese Nationalist Party by the Chinese Communist Party during China’s civil war, the bank followed the Chinese Nationalist Party and transferred its assets and operations to Taiwan. Hence, the bank has little presence in Shanghai city despite its namesake. Rather, most of its operations are concentrated in Taiwan. Shanghai Commercial & Savings Bank’s headquarters is in Taipei.

13. Taishin International Bank (台新國際商業銀行)

Founded in 1992, Taishin Bank is one of the leading banks in Taiwan. It is a subsidiary of the Taishin Group, which is a public company trading on the Taiwan Stock Exchange. Taishin Bank’s headquarters is in Taipei.

14. Bank SinoPac (永豐金融控股公司)

Founded in 1992, Bank SinoPac is one of the leading banks in Taiwan. It has overseas branches in Hong Kong, Kowloon, Macau, Los Angeles, and Ho Chi Minh City. Bank Sinopac’s headquarters is in Taipei.

15. Taiwan Business Bank (臺灣中小企業銀行)

TBB is the abbreviated name for the Taiwan Business Bank. TBB is a public company trading on the Taiwan Stock Exchange. Over years of reorganization, TBB is now a major provider of financial services to small and medium-sized enterprises. Today, it has over a hundred branches. Taiwan Business Bank’s headquarters is in Taipei.

A Gem Among the Top Banks in Taiwan: Chunghwa POST – (中華郵政)

As is the case in Mainland China, Taiwan’s postal office not only processes mails, but also serves as a semi-bank. Taiwan’s postal office not only take mails, but also deposits. Because the postal office has a network of over a thousand post offices across the island, it has the single largest share of Taiwan’s deposit market. However, its services are primarily related to savings and remittance. It doesn’t offer as wide range of financial services as a pure bank.

Full Ranking of Top Banks in Taiwan

Here’s a more complete ranking of the top 30 banks in Taiwan.

Top Banks in Taiwan Ranking

Preparing for a Career with the Top Banks in Taiwan

Lumovest is the finest institution in the world to learn financial and investment analysis. We teach you how to analyze financials and investments from the grounds up. Our curriculum is based on how things are done at the top banks and the top investment firms. Our lessons are interactive and visually intuitive. As a result, our courses are very practical and very relevant to what you’ll do on a day-to-day basis. The courses are taught by former Goldman Sachs investment banker.

Developing a strong financial analytical skillset will help you stand out during the Taiwan banks’ hiring process. Through our courses, you’ll learn accounting, financial modeling, LBO, DCF, M&A and valuation. At the end, you’ll receive an official blockchain-verified digital certification, which you can showcase on your resume. You can sign up here.

Valuation Methods

By Valuation No Comments

What are Valuation Methods?

Valuation Methods are ways to determine how much an asset is truly worth. There are 3 main valuation methods to determine how much a company or a stock is worth.

Valuation Multiples

By Valuation No Comments

What are Valuation Multiples?

Valuation Multiples are ratios that you can use to determine how much a company or is worth. The main valuation multiples are EV/Sales, EV/EBITDA, and P/E.

Walk me through a DCF model.

By Investment Banking Interview Questions No Comments

The investment banking interview question we’re going to go over today is “Walk me through a DCF model.” This is a very basic and very common technical question that can come up in investment banking summer analyst and full-time interviews. Here’s exactly how you should answer it.

Interview Answer

“The DCF analysis helps us determine the intrinsic value of the company.

The first step is to calculate WACC. We would take the company’s Cost of Equity and after-tax Cost of Debt and weigh them proportionally based on the company’s long term capital structure.

The second step is to project out the company’s Unlevered Free Cash Flow, usually for a period of 5-7 years.

Next, we need to calculate the company’s Terminal Value. We can calculate it using either the Perpetuity Growth Method or the Terminal Multiple Method.

And finally, we would discount the future Unlevered Free Cash Flow and Terminal Value back to the present using WACC, which would give us the intrinsic value of the company.”

Key Takeaway

And that’s it for the “Walk me through a DCF model” interview question. The key mistake to avoid here is don’t be long-winded. Don’t go into every little detail of the DCF model. Some candidates spend several minutes talking the interviewer through the DCF model. That’s not the right way to do it because it turns into a monologue. Use what we wrote above and keep it short and sweet.

More IBD Questions

Walk me through the three financial statements.

Which financial statement is the most important?

Walk me through a merger model.

Walk me through a merger model

By Investment Banking Interview Questions No Comments

The investment banking interview question we’re going to go over today is “Walk me through a merger model”. This is also known as “Walk me through an M&A analysis”. It is a standard question that comes up very frequently. We’re going to show you exactly how you should answer it.

Sample Answer

“The purpose of the merger model is to evaluate whether the transaction will be beneficial to the company’s earnings. Before we begin, we should have the acquirer’s standalone Earnings per Share before the M&A transaction. 

The first step in a merger model is to determine the purchase price. Second, we need to build the Sources and Uses section, so that we know how the acquirer will finance the transaction: whether it’s done through cash, debt or stocks. Next, we should add up the acquirer and the target’s standalone financials, such as Revenue and COGS, and make pro forma transaction adjustments. Some examples of these adjustments are Revenue Synergies, Cost Synergies and Incremental Interest Expense. This would give us the acquirer’s Earnings per Share after the M&A transaction.

Once that’s done, we can compare the Earnings per Share before and after the M&A transaction to determine whether the deal is accretive or dilutive.”

Key Takeaway

And that’s how you answer the question: “Walk me through a merger model”! The key mistake to avoid here is don’t be long-winded. In other words, don’t go into every little detail of the merger model. Don’t go into granular stuff like goodwill creation, line-by-line calculations. Some candidates spend several minutes talking the interviewer through the merger model and that’s not what you want to do. The sample answer we gave you above is basically what you want to deliver in a real interview. You just want to show the interviewer that you understand the purpose of the merger model and how it flows.

Other IBD Interview Questions

Walk me through the three financial statements

Which financial statement is the most important?

Walk me through a DCF.

Walk me through an LBO model.

By Investment Banking Interview Questions No Comments

The investment banking interview question we’re going to go over today is “Walk me through an LBO model”. This question comes up less frequently than “Walk me through a DCF” but it’s still very common. We’re going to show you exactly how you should answer it.

Interview Answer

“The purpose of the LBO model is to estimate the returns a private equity firm can earn from investing in the company.

The first step in a LBO model is to determine the entry valuation. We need to know how much the PE firm will pay to buy the company. Second, we need to build the Sources and Uses section, so that we know how the PE will finance the transaction, like how much leverage they’ll be using. Third, we should project out the company’s future Levered Free Cash Flow over its holding period, usually 5-7 years.

Once that’s done, we can perform the last step, building the returns analysis to calculate the MOIC and the IRR.”

Key Takeaway

And that’s how you can answer the interview question “Walk me through an LBO model”. Here’s an important takeaway. You don’t have to walk us through a full blown three statement LBO. For whatever reason, lots of candidates like to dive into three statement LBOs. They’d walk us through all these Balance Sheet adjustments and fancy integrations. In fact, most of the LBOs that you’ll build won’t be three statements. Three statements are built mainly to impress clients. They don’t have much functional use.

Other IBD Interview Questions

Which financial statement is the most important?

Walk me through a DCF.

Walk me through a merger model.

Walk me through the different acquisition currencies in an M&A deal

By Investment Banking Interview Questions No Comments

The investment banking interview question we’re going to go over today is “Walk me through the different acquisition currencies in an M&A deal.” Here’s what you can say.

Interview Answer

“In general, there are three acquisition currencies in an M&A deal: Cash, Debt, and Stock. 

The acquirer can use the cash it has in its bank account to pay for the acquisition. This is usually the most attractive because it’s the cheapest form of capital. In addition to the cash the acquirer has in the bank, it can also borrow debt. Debt comes with interest expense and covenants, which is less attractive than using the company’s own Balance Sheet cash. And finally, the acquirer can also pay with its stocks. This is oftentimes the most expensive form of capital and we see this used pretty often in mergers of equals.”

Additional Tip

That’s what you can say for this interview question: “Walk me through the different acquisition currencies in an M&A deal”. Notice the order of the currencies. We ordered it in a very specific way: Cash, Debt, and then Stocks. We ordered them from the cheapest source of financing to the most expensive. Investment bankers care a lot about ordering. This is one way to show the interviewer that you’re thoughtful and well organized.

More IBD Interview Questions

What are the exit strategies in an LBO?

Why would a company want to acquire another company?

Tell me about a recent M&A deal that you followed.

Walk me through the three financial statements.

By Investment Banking Interview Questions No Comments

The investment banking interview question we’re going to go over today is “Walk me through the three financial statements.” This is a very basic and very common technical question that can come up in summer internship and full-time interviews. Here’s exactly how you should answer it.

Sample Answer

“The three financial statements are the Income Statement, Cash Flow Statement and the Balance Sheet.

The Income Statement tells us how much revenue the company generated and how much costs it incurred over a period of time. Starting with Revenue, we subtract Cost of Goods Sold to get Gross Profit. Then, we subtract operating expenses, such as SG&A and R&D to get EBIT. And lastly, we subtract interest expense and taxes to arrive at Net Income.

The Cash Flow Statement shows us the movement of cash – how much cash is coming in and going out of the company. It has three sections: Cash Flow from Operations, Cash Flow from Investing and Cash Flow from Financing.

The Balance Sheet indicates what the company owns and what it owes. It has three sections: Assets, Liabilities, and Shareholder’s Equity. Assets must equal Liabilities plus Shareholder’s Equity.

So that’s a high-level overview of the three financial statements.”

Key Takeaway

When the interviewer asks you to “walk me through the three financial statements”, the key mistake to avoid is don’t go into too much detail. You don’t have to tell the interviewer everything you know about the three statements. Keep the walk-through short and high-level.

Other IBD Interview Questions

When the interviewer asks you to “walk me through the three financial statements”, the key mistake to avoid is don’t go into too much detail. You don’t have to tell the interviewer everything you know about the three statements. Keep the walk-through short and high-level.

What are the different types of debt and how are they different?

By Investment Banking Interview Questions No Comments

The investment banking interview question we’re going to go over today is “What are the different types of debt and how are they different?” Here’s what you can say.

Interview Answer

“The three common types of debt are: Revolver, Term Loan, and Bond.  

Revolver is the most senior type of debt. It’s like a credit card in that borrowers can borrow, repay, borrow again and then repay again as long as they stay within the given limit.

Term Loan is the next most senior type of debt. Borrowers can repay it before the maturity debt.

Bond is relatively junior in the capital structure. Borrowers must keep incurring interest on it until maturity and cannot repay it in advance.”

Additional Tip

That’s what you can say for this interview question: “What are the different types of debt and how are they different”. One sentence identifying the type of debt and its relative seniority, followed by one sentence explaining what makes it special. Don’t go into a monologue, keep it short and sweet.

More IBD Interview Questions

Why would a company want to acquire another company?

Tell me about a recent M&A deal that you followed.

Walk me through the different acquisition currencies in an M&A deal.

What are the different valuation methodologies?

By Investment Banking Interview Questions No Comments

The investment banking interview question we’re going to go over today is “What are the different valuation methodologies?” This is a very basic question, so interview is not going to last very long if you don’t get this question correct. Here’s what you can say for your answer.

Interview Answer

“There are four main valuation methodologies. First, there’s DCF, which values the business based on its future cash flow. Second, there’s Public Comparables, which values the business based on what peers are trading at. Third, there’s Precedent Transactions, which values the business based on past M&A transactions. And lastly, there’s LBO, which values the business based on the return it can generate for investors. These are the four main valuation methodologies.”

Additional Tip

In short, this is how you can answer this question: “What are the different valuation methodologies”. Don’t talk too much for your answer to this question. It’s so simple that the interviewer is not expecting an extended answer from you. It’s often used as a stepping stone to pave the way for the follow up valuation questions.

More IBD Interview Questions

What is working capital and what are some examples?

Difference between intangible assets and goodwill.

What is non-controlling interest and why do some companies have it?

What are the exit strategies in an LBO?

By Investment Banking Interview Questions No Comments

The investment banking interview question we’re going to go over today is “What are the exit strategies in an LBO?” Here’s what you should say.

Interview Answer

“There are two main exit strategies in an LBO: Sale, IPO and Dividend Recapitalization.  

In a sale, another buyer acquires the entire company from the private equity firm. So the private equity firm sells all of its ownership in the company to that buyer. This is oftentimes the most preferred exit strategy.

Alternatively, the private equity firm can choose to take the company public and exit via an IPO. It’ll still hold some equity ownership after the IPO, but since the company is now publicly traded, the PE firm can slowly sell down its shares in the stock market.

In a Dividend Recap, the company takes on more debt and use the proceeds from the debt to pay dividends to the PE firm.

These are the three exit strategies in an LBO.”

Additional Tip

That’s all you have to say for this question. Now to be honest, we don’t really consider Dividend Recap to be a real exit strategy. That’s because the PE firm’s ownership percentage in the portfolio company doesn’t really reduce after the Dividend Recap. The PE firm will still need to pursue a Sale or an IPO after the Dividend Recap in order to fully exit the investment. However, for interview purposes, you should mention it in your answer.

More IBD Interview Questions

How does $10 increase in D&A affect UFCF?

What is WACC and how do you calculate it?

What makes a great LBO candidate?

What are the major SEC filings?

By Investment Banking Interview Questions No Comments

The investment banking interview question we’re going to go over today is “What are the major SEC filings”. Now the SEC has a lot of filings. Even though it’s unsaid in the question, you should know without asking that this question is talking about the filings that public companies make. So limit your answer to only corporate filings. That’s what the interviewers are asking even if they’re not specifying it. Here’s what you can say.

Interview Answer

“There are three major SEC filings that we use on a day-to-day basis: the 10-K, 10-Q, and the 8-K. The 10-K is the annual report and provides a comprehensive overview of the company, such as what the business does, the risks, and the financials. The 10-Q is the quarterly report that public companies file every 3 months. It provides the investment community with a quarterly performance update. The 8-K is the current report. Companies file this report with the SEC whenever something important happens to keep the public in the loop. These are the most important filings.”

Key Takeaway

That’s how you’d answer this question: “What are the major SEC filings”. The SEC has a lot of filings. You don’t need to go through every one of them. Especially for entry level investment banking interviews, you just want to touch upon the three main ones: 10-K, 10-Q, and 8-K.

Other IBD Interview Questions

LBO model walk-through.

Merger model walk-through.

DCF (Discounted Cash Flow) model walk-through.

What is non-controlling interest and why do companies have it?

By Investment Banking Interview Questions No Comments

The investment banking interview question we’re going to go over today is “What is non-controlling interest and why do companies have it?” Non-Controlling Interest is not a very intuitive concept, and so a lot of candidates get this question wrong. Here’s what you can say for your answer.

Interview Answer

“Non-Controlling Interest is the value of the stake in a company’s subsidiary that the company controls but doesn’t own. It’s a line item on the Balance Sheet under the Shareholder’s Equity section. 

Under US GAAP, companies have to include 100% of the financials of all subsidiaries that they control. But occasionally, companies control subsidiaries that they don’t own 100% of. And so to reflect the fact that there’s value belonging to other parties, companies record Non-Controlling Interest.”

Additional Tip

To sum up, that’s an example of how you can answer the question: “What is non-controlling interest and why do companies have it”. A common mistake we see candidates make is that they often use the term Minority Interest and Non-Controlling Interest interchangeably. However, the two are not synonymous. The correct term is Non-Controlling Interest, not Minority Interest.

More IBD Interview Questions

What is unlevered free cash flow and how do you calculate it?

What is working capital and what are some examples?

Difference between intangible assets and goodwill

What is the difference between intangible assets and goodwill?

By Investment Banking Interview Questions No Comments

The investment banking interview question we’re going to go over today is “What is the difference between intangible assets and goodwill?” The two are very similar. They’re both assets, but they are non-physical, meaning you can’t physically touch either of them. So how do you articulate the difference between them in an interview? Here’s what you can say.

Interview Answer

“Intangible Assets are non-physical assets that can be identified and individually quantified. So for example, we might be able to single out one particular patent, and we can quantify how much that one patent is worth on the Balance Sheet.  

By contrast, Goodwill are non-physical assets that cannot be identified and cannot be individually quantified. We know there’s something the company has that has value, but we don’t know exactly what it is. It could be reputation, good relationship with suppliers, good relationship with customers, or it could be something else. We know there’s value somewhere but we just can’t pinpoint where that value is coming from. Since we can’t identify the exact components within Goodwill, naturally, we can’t individually quantify the components that make up Goodwill either.

So whereas we can identify and individually quantify Intangible Assets, we can’t identify and individually quantify Goodwill.”

Additional Tip

So that’s how you should answer this interview question: “What is the difference between intangible assets and goodwill”. The biggest mistake candidates make in this question is the inability to eloquently articulate the difference. They’d speak for a long time and we’d still have no idea what their point is. That’s the most common mistake I saw during my time on Goldman Sachs’s recruiting team. So make sure you can clearly explain the difference between the two.

More IBD Questions

How does $10 increase in debt affect the three financial statements?

What is UFCF and how do you calculate it?

What is working capital and what are some examples?

What is unlevered free cash flow and how do you calculate it?

By Investment Banking Interview Questions No Comments

The investment banking interview question we’re going to go over today is “What is unlevered free cash flow and how do you calculate it?” Unlevered Free Cash Flow, or UFCF, is an extremely important metric for investment banking. Here’s how you can answer it in an interview.

Interview Answer

“Unlevered Free Cash Flow is the amount of cash flow a company generates after covering all expenses and necessary expenditures. So these are the cash flow the company is free to use however it likes because it has already paid its bills and reinvested into future growth.

To calculate Unlevered Free Cash Flow, we start EBITDA, less D&A because it’s tax-deductible, to get EBIT. And then we tax-effect EBIT to arrive at NOPAT. From here, we add back D&A, adjust for Changes in Working Capital and subtract Capital Expenditures. That’ll bring us to Unlevered Free Cash Flow.”

Additional Tip

And there you have it. That’s how you should answer this question: “What is unlevered free cash flow and how do you calculate it”. An important thing to keep in mind is make sure you understand that Unlevered Free Cash Flow is different from Levered Free Cash Flow. The two are different, so make sure you don’t get them mixed up.

More IBD Interview Questions

How do you project expenses?

$10 increase in depreciation impact on the three financial statements

$10 increase in debt impact on the three financial statements

What is WACC and how do you calculate it?

By Investment Banking Interview Questions No Comments

The investment banking interview question we’re going to go over today is “What is WACC and how do you calculate it?” Here’s what you should say.

Interview Answer

“WACC stands for Weighted Average Cost of Capital. It’s a quantitative measure of risk given the company’s business model and capital structure.  

To calculate WACC, first we’d multiply Cost of Equity by the percentage of equity in the capital structure. Next, we would multiply the After-Tax Cost of Debt by the percentage of debt in the capital structure. Then we should add these two numbers up and that’ll give us WACC.”

Additional Tip

There you have it. That’s how you can phrase your answer to this question: “What is WACC and how do you calculate it”. When it comes to describing what WACC is, we often hear people say that it’s a discount rate. However, that’s a very surface-level understanding. In an interview, you want to show that you understand the underlying concept. And saying that WACC measures risk demonstrates that.

More IBD Interview Questions

How do you select which companies to use in your comps?

Do we care more about UFCF or LFCF in LBO?

How does $10 increase in D&A affect UFCF?

What is working capital and what are some examples?

By Investment Banking Interview Questions No Comments

The investment banking interview question we’re going to go over is “what is working capital and what are some examples?” Working capital is a commonly misunderstood concept. So let’s make sure you can articulate it clearly and succinctly in an interview. Here’s how you can craft your answer.

Interview Answer

“Working Capital measures a company’s liquidity at a specific point in time. It measures liquidity by comparing how much cash the company can get from its assets with how much cash the company has to pay for its liabilities in the next 12 months. Naturally, if the company receives more cash than it has to pay, then it’ll have sufficient liquidity. 

Some examples of Working Capital are Accounts Receivables, Inventory, Accounts Payables, and Prepaid Expenses.”

Additional Tip

That’s all you have to say for this question: “What is working capital and what are some examples”. As always, cut to the chase and get straight to the point. The biggest mistake candidates make with this question is the inability to eloquently articulate what exactly working capital is and instead have to concoct an extended example to demonstrate working capital.

More IBD Interview Questions

What is UFCF and how do you calculate it?

How does $10 increase in debt affect the three financial statements?

How does $10 increase in depreciation affect the three financial statements?

What makes a great LBO candidate?

By Investment Banking Interview Questions No Comments

The investment banking interview question we’re going to go over today is “What makes a great LBO candidate?” Here’s what you should say.

Interview Answer

“I think a great LBO candidate have three important characteristics. First, it should have a leading market position. Ideally, the business has some sort of competitive advantage against competitors. Second, it should have very stable and predictable cash flow. That’s because the private equity firm will be using a lot of leverage, and having stable and predictable cash flow is critical to pay down these debt obligations. And finally, a great LBO candidate has room for operational improvements. The private equity firm would want to implement changes to accelerate growth and improve profitability. 

So to sum up, I think having a leading market position, predictable cash flow and room for operational improvements are characteristics that make a great LBO candidate. ”

Additional Tip

That’s all you have to say for this question: “What makes a great LBO candidate”. Separately, there are plenty of other things you can say too, such as being undervalued, fast grower, and a stellar management team. Feel free to mix and match, but that’s the overall structure to your answer.

More IBD Interview Questions

Do we care more about UFCF or LFCF in LBO?

How does $10 increase in D&A affect UFCF?

What is WACC and how do you calculate it?

Which financial statement is the most important?

By Investment Banking Interview Questions No Comments

The investment banking interview question we’re going to go over today is “Which financial statement is the most important?” This is a very basic and very common technical question that can come up in summer internship and full-time interviews. Here’s exactly how you should answer it.

Interview Answer

“The most important financial statement is the Cash Flow Statement. It tells us how much cash is coming in and going out of the company. The reason the Cash Flow Statement is the most important, is that when we evaluate the health of a business –that is, whether the company has sufficient cash to keep running – and when we try to determine the valuation of the company, we base it on how much free cash flow it generates.

We can calculate free cash flow directly from the Cash Flow Statement. It’s just Cash Flow from Operations minus CapEx. But we can’t do it using just the Income Statement or just the Balance Sheet. That’s why the Cash Flow Statement is the most important.”

Key Takeaway

This is exactly how we would answer the question: “which financial statement is the most important?”. The key here is to try to demonstrate that you understand why. Most candidates correctly identify that the Cash Flow Statement is the most important because in finance we care about cash flow. But very few of them are able to pinpoint exactly why. If you can explain that it’s because you can calculate free cash flow using solely the Cash Flow Statement, that’ll show interviewers you actually “get it”.

Other IBD Interview Questions

Walking the interviewer through the three financial statements.

Walk me through a DCF.

Walk me through a merger model.


Which valuation method gives the highest valuation?

By Investment Banking Interview Questions No Comments

The investment banking interview question we’re going to go over today is “Which valuation method gives the highest valuation?” This often appears as a follow-up question to the “what are the different valuation methodologies” question. You should check out that video if you haven’t seen it yet. Here’s what you can say for your answer.

Interview Answer

“It depends. Sometimes it’s Precedent Transactions because they include control premium. Occasionally, it’s Public Comparables if the market is trading at record high multiples. And it can also be DCF if we use very optimistic assumptions. So there isn’t one valuation methodology that always gives the highest valuation. It varies.”

Additional Tip

In short, that’s all you have to say for your answer to the “which valuation method gives the highest valuation” question. The most common mistake I see candidates make is answering this interview question by specifying one single methodology. Candidates usually say Precedent Transactions and identify control premium as the reason. But in reality, when we look at the valuation football field for companies we work on, Precedent Transactions definitely does not always give the highest valuation. Sometimes it does and plenty of times it does not. So the method that would give you the highest valuation varies from company to company.

More IBD Questions

Difference between intangible assets and goodwill

What is non-controlling interest and why do some companies have it?

What are the different valuation methodologies?

Why would a company want to acquire another company?

By Investment Banking Interview Questions No Comments

The investment banking interview question we’re going to go over today is “Why would a company want to acquire another company?” Here’s what you can say.

Interview Answer

“Companies want to acquire other companies usually because there’s a strategic rationale and because there’s financial benefit. Strategically, a company could see an acquisition as a way to expand into a new market, to broaden its product portfolio, or to consolidate the market. This strengthens the company’s market position and makes it a stronger business. Financially, acquisitions can also create synergies, which makes the pro forma company even more profitable. That’s why companies want to pursue acquisitions.”

Additional Tip

That’s how you should answer this question: “Why would a company want to acquire another company”. There are plenty of other things you can say too, such as maybe the target is undervalued, maybe the acquirer wants to gain access to the target’s intellectual property, or maybe the acquirer wants to obtain the target’s employees. Feel free to mix and match, but these are some examples of strategic rationale.

More IBD Interview Questions

What is WACC and how do you calculate it?

What makes a great LBO candidate?

The different exit strategies in an LBO

Zero-Based Budgeting

By Management & Strategy No Comments

What is Zero-Based Budgeting

Zero-based budgeting is a budgeting method that requires companies to justify every expense, rather than simply relying on previous spending habits. It involves starting each budget from scratch and allocating funds based on current needs and priorities. With zero-based budgeting, companies start each budget cycle from a baseline of zero and allocate funds based on current needs and priorities. This budgeting approach is becoming increasingly popular in corporate finance as companies seek to optimize their spending and improve their bottom line.

In this article, we’ll explore how zero-based budgeting works in the context of corporate finance, including its benefits, challenges, and real-world examples. We’ll also go over the famous case of how this budgeting method went wrong for Heinz, the global ketchup maker.

How Zero-Based Budgeting Works

Step 1: Define the budget period

The first step in zero-based budgeting is to define the budget period. This could be a month, a quarter, or a year, depending on the company’s needs and preferences.

Step 2: Identify the activities and costs

The next step is to identify all the activities and costs that will be incurred during the budget period. This includes all the operational expenses, such as salaries, rent, utilities, marketing, and other overhead costs. You’re starting from zero budget and allocating money to the budget based on these identified activities and associated costs.

Step 3: Categorize the activities and costs

Once all the activities and costs have been identified, they should be categorized according to their function. For example, salaries and benefits would be categorized under “personnel,” while rent and utilities would be categorized under “facilities.”

Step 4: Determine the criticality of each activity and cost

The next step is to determine the criticality of each activity and cost. This involves assessing the importance of each activity and cost to the company’s overall operations and goals. This will help determine which activities and costs should receive priority in the budget.

Step 5: Set priorities and allocate resources

Based on the criticality of each activity and cost, the company can then set priorities and allocate resources accordingly. This involves assigning a specific amount of money to each category based on the company’s current needs and priorities.

Step 6: Monitor and adjust

Throughout the budget period, it’s important to monitor spending and adjust the budget as necessary. This involves comparing actual spending to the budgeted amounts and making adjustments to the budget to ensure that the company stays on track.

Benefits of Zero-Based Budgeting

There are several benefits to using zero-based budgeting in corporate finance, including:

  • Increased financial control: It requires companies to be more intentional with their spending, which can help them take control of their finances.
  • Improved budget accuracy: It helps companies identify inefficiencies in their spending and redirect funds to areas that will have the greatest impact on their bottom line.
  • Better decision making: It forces companies to prioritize their spending, which can help them make better decisions about how to allocate their funds.
  • Improved operational efficiency: By scrutinizing every expense, companies can identify areas where they can streamline their operations and reduce costs.

Challenges of Zero-Based Budgeting

While there are many benefits to using zero-based budgeting in corporate finance, there are also some challenges to consider, including:

  • Time-consuming: Zero-based budgeting requires a significant amount of time and effort to implement, which can be a challenge for companies with limited resources.
  • Resistance to change: Some employees may be resistant to the changes that come with zero-based budgeting, such as increased scrutiny of expenses and stricter budget constraints.
  • Difficulty in tracking expenses: Zero-based budgeting requires careful tracking of expenses, which can be challenging for companies with complex accounting systems or decentralized operations.

Real-World Examples of Zero-Based Budgeting

Here are some real-world examples of how companies have implemented zero-based budgeting in their corporate finance.

In 2014, Kraft Heinz announced plans to implement zero-based budgeting across all of its brands. The company identified $1.5 billion in savings through the process, which it reinvested in its brands and products.

In 2015, Coca-Cola announced plans to implement zero-based budgeting as part of a broader effort to reduce costs and improve profitability. The company identified $3 billion in savings through the process, which it reinvested in marketing and innovation.

In 2018, HanesBrands announced plans to implement zero-based budgeting as part of an effort to reduce costs and improve margins. The company identified $150 million in savings through the process, which it reinvested in its business and returned to shareholders.

When Zero-Based Budgeting Goes Wrong

Zero-based budgeting can be an effective tool for managing corporate finances, but it’s not without its risks. A famous case of this practice going wrong happened to Heinz, the beloved global ketchup maker. In the case of Heinz, zero-based budgeting had some unintended consequences that hurt the company’s bottom line.

Following 3G Capital’s buyout of Heinz in 2013, the new management team implemented zero-based budgeting as part of a broader effort to improve profitability. The goal was to scrutinize every expense and allocate resources more efficiently. However, this approach had some negative consequences that ultimately hurt Heinz’s bottom line.

One of the main issues with zero-based budgeting at Heinz was that it led to significant cuts in marketing and research and development (R&D) spending. The new management team believed that these areas were not critical to the company’s success and that the funds could be better allocated elsewhere. As a result, Heinz reduced its marketing and R&D budgets by 30% and 40%, respectively.

While these cuts initially helped improve Heinz’s profitability, they also had some unintended consequences. For example, sales of some of Heinz’s key products, such as ketchup and frozen foods, began to decline as a result of reduced marketing spending. Additionally, the company’s innovation pipeline slowed as a result of reduced R&D spending, which hurt its ability to introduce new products and stay competitive in the market.

Overall, the cuts to marketing and R&D spending had a significant impact on Heinz’s bottom line. The company’s sales began to decline, and it struggled to stay competitive in the market. In response, the new management team had to reverse some of the cuts and reinvest in marketing and R&D, which further impacted the company’s profitability in the short term.

Conclusion

Zero-based budgeting can be a powerful tool for optimizing corporate finance and improving profitability. By starting each budget from scratch and carefully scrutinizing every expense, companies can prioritize their spending and allocate their funds more effectively. While there are some challenges to implementing zero-based budgeting, the potential benefits are significant, including increased financial control, improved budget accuracy, better decision making, and improved operational efficiency. Real-world examples demonstrate that zero-based budgeting can yield significant savings and drive business growth. As such, it’s worth considering implementing zero-based budgeting as part of your corporate finance strategy. By taking a proactive approach to managing your expenses and prioritizing your spending, you can achieve greater financial success and position your company for long-term growth.

Learn More

At Lumovest, we’re building the place where anyone can learn finance and investing in an affordable and easy-to-understand manner. Our courses are far more intuitive, visualized, logical and colloquial than your college professor-taught courses. Our courses are taught by Goldman Sachs investment banker who has worked on transactions worth over $50 billion. We designed our courses to prepare you to succeed in the world of high finance. You’ll learn how to conduct financial analysis exactly like how it’s done on Wall Street’s top firms. Upon completion of the courses, you will receive our Global Financial & Investment Analyst (GFIA) certification. You can sign up here.

By using Lumovest, you agree to our use of cookies, Privacy Policy and Terms of Service.

Accept