What is an Income Statement?
The Income Statement shows the company’s revenue, cost and profits over a period of time. Along with the Cash Flow Statement and Balance Sheet, it’s one of the three main financial statements. You can think of it as a financial report that tells you how much money the company made during the period. Pretty much all of the highest paying finance jobs would require a strong understanding of this financial statement.
The Income Statement adds up all the sources of income and subtracts all expenses. What it has at the end, is profit, also known as “the Bottom Line”.
The Bottom Line
A key takeaway from an Income Statement is how much profit the company earned during the reporting period. This financial statement starts with revenue, which is often the biggest source of income, adds other incomes and subtracts expenses.
If the company generated more income than cost during the period, it’ll record a profit. This is known as Net Income or Net Profit. But if the company incurred greater cost than what it generated in income, it’ll record a loss. This is known as Net Loss. Either way, the Net Profit / Loss number is often show at the bottom of the report. For this reason, it’s also known as the “Bottom Line”.
The Net Income / Net Loss number is the key takeaway from the Income Statement. That’s why the Income Statement is known as “Statement of Profit & Losses” or “Statement of P&L”. P&L is just an abbreviation for Profit & Losses. So the next time someone talks about P&L, you should know that they’re referring to the Income Statement. And because P&L is the key financial metric that characterizes a business operations, the Income Statement is sometimes also called the “Statement of Operations”.
Underneath Net Income, publicly-traded companies will also show Net Income per Share. This represents the profit earned for each share given how many shares the company has outstanding. Whereas Net Income represents the total profit for the entire company, Net Income per Share represents the piece of the profit entitled by each share. This is also known as Earnings per Share or EPS.
Essentially, the Income Statement shows how the money made from selling products is transformed into profits and profit per share.
Income Statement Example
Here’s a real Income Statement example for Snapchat (NYSE:SNAP). You can find this example on PDF page 68 of Snap’s annual report.
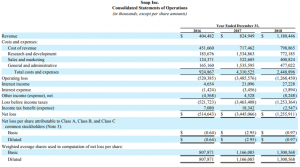
As you can see, this financial report starts with Revenue, and then subtracts expenses and adds other sources of income. In this case, the total expense is greater than total income, so the company is incurring a Net Loss.
First, notice that Snap’s Income Statement is called “Consolidated Statements of Operations”. This is common. Publicly-traded companies will usually call it “Statements of Operations” in official documents as opposed to “Income Statement”. That’s because “Statement of Operations” sounds more official than “Income Statement”. However, content-wise, it’s the same as Income Statement. Therefore, if you’re looking for Income Statements of publicly-traded companies, you should search for “Statement of Operations” instead.
Second, notice that the numbers are presented “in thousands, except per share amounts”. This means that data related to financials per share are presented as-is. In other words, $2.95 of net loss per share means exactly $2.95. Not $2,950. However, all other numbers are shown in thousands. In Snapchat’s Income Statement, that means all the numbers between Revenue and Net Loss are shown in thousands. Same thing goes for “weighted average shares used in computation of net loss per share”.
And third, notice that the Income Statement often shows several years of data. It’s standard for companies to show several years of data across the columns. They do this so readers can easily see how the company performed over time. Setting consecutive years’ data side-by-side makes it easy for analysts to identify patterns. On a related note, notice that the periods are clearly labeled. “Year Ended December 31” to let readers know that the numbers reflect performance over a one year period.
Income Statement Format
Now we know what the Income Statement is and what it looks like. It’s time to learn the Income Statement format and how it’s structured. Broadly speaking, there are two types of Income Statement formats: Single-Step Income Statement and Multi-Step Income Statement.
Single-Step Income Statement:
The Single-Step Income Statement is a format showing the calculation to Net Income / Net Loss through a single step. It simply subtracts total expenses from total income (Revenue and other incomes). Here’s what a Single-Step Income Statement would look like.
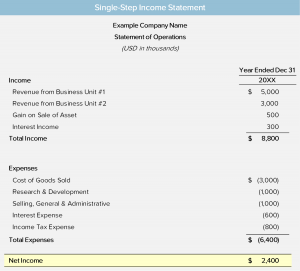
Single-Step Income Statements are generally used by small to medium sized and privately-held companies. Large-sized, publicly-traded companies rarely use the Single-Step Income Statement format. Instead, most public-traded companies adopt the Multi-Step Income Statement format.
Multi-Step Income Statement:
The Multi-Step Income Statement is a format that shows the calculation to Net Income / Net Loss through multiple steps. It calculates other profit metrics along the way, before arriving at Net Income / Net Loss. Instead of calculating the bottom line through a single step, the Income Statement makes multiple calculations. It makes a few stops along the way before arriving at Net Income / Net Loss. Here’s the same Income Statement that we used for Single-Step laid out in Multi-Step format:
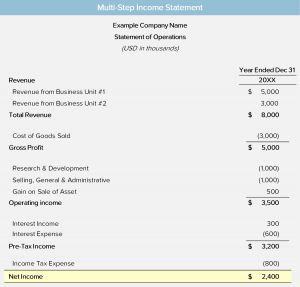
Most large-sized, publicly-traded companies adopt the Multi-Step Income Statement format. They do this because it highlights the company’s various profit metrics. You can think of this as the standard Income Statement format for most large companies. Let’s dig deeper to understand how a standard Income Statement (Multi-Step) is structured.
[Income Statement layout]The Income Statement always begins with Revenue. Revenue is always the first line on the report. It’s always at the top. For this reason, it’s also known as “the top line”. This stands in direct contrast to Net Income / Net Loss, which is known as “bottom line”.
[Income Statement layout – add cost of revenue]From Revenue, we subtract Cost of Revenue to calculate Gross Profit. Gross Profit measures the amount of profit purely from what the company sells.
[Income Statement layout – OpEx]And then from Gross Profit, we add other incomes and subtract all expenses related to the core business operations. Collectively, this gets us to Operating Income. It measures the amount of profit the company generated from its core business operations.
[Income Statement layout – Net Income]And then from Operating Income, we add and subtract non-operating related income and expenses. This gets us to the Net Income / Net Loss number, which is the bottom line.
See? It takes multiple steps along the way to go from Revenue to Net Income / Net Loss. Hence the name, Multi-Step Income Statement.
The Accounting Principles
Four accounting principles underpin how revenue and expense amounts are recognized. They guide the companies in determining the amount of revenue and expenses to record.
Monetary Unit Principle:
The first principle underpinning the Income Statement is the Monetary Unit Principle. The Monetary Unit Principle states that only transactions measurable in monetary units may be recorded in the company’s financial statements. If something can’t be measured with money, it can’t be recorded on the Income Statement.
Stable Dollar Assumption:
The Stable Dollar Assumption is an assumption that the currency used to prepare the financial statements (U.S. Dollar for American companies) is stable over time, without being affected by inflation or deflation.
Accrual Principle:
The Accrual Principle requires companies to recognize revenue based on when it’s earned rather than when payment is received. For example, suppose a company has delivered goods to a customer who has not yet paid. Under the Accrual Principle, the company should record this Revenue on the Income Statement.
Likewise, the Accrual Principle also requires companies to recognize expenses based on the Matching Principle and when it’s incurred as opposed to when cash payments are made. For example, companies would have to record the month’s utility expense even if they haven’t paid yet.
Small, mom and pop stores are likely to ignore the Accrual Principle. They tend to prepare their financial statements on a cash basis, based on when cash is received and paid. It’s a lot easier for them to track cash movements than it is to track accrued revenue and expenses. However, all publicly-traded companies in the US and Europe will observe the Accrual Principle and prepare their Income Statement accordingly.
Matching Principle:
The Matching Principle requires companies to record expenses on the Income Statement in the same period as the related Revenue. Revenue and related expenses are “matched” together and recorded in the same period. If an expense is directly related to revenue (i.e. cause and effect relationship), it should be recorded in the same period as the corresponding Revenue. If an expense isn’t directly-related to Revenue, the expense should be recorded in the period that it was used.
Income Statement Line Items
Let’s go over the common Income Statement line items. There may be some variations among companies, but the gist is the same. Below, we lay out these common line items in the order they usually appear.
Revenue
Revenue is the value of goods and services that the business has sold. Companies generally provide their revenue recognition guidelines to explain the criteria they follow to determine whether a transaction is eligible to be recorded as Revenue.
Cost of Goods Sold (COGS)
Cost of Goods Sold is the cost to provide the goods and services that the business has sold. Companies that sell physical products would call it “Cost of Goods Sold” but companies that sell services or a mix of product and services would call it “Cost of Service” or “Cost of Revenue”.
Gross Profit
Gross Profit represents the profit generated purely from the goods and services that the business has sold. It’s the difference between Revenue and Cost of Goods Sold. Put another way, it’s the money company sold its products for less the cost of these products.
Research & Development (R&D)
Research & Development are expenses related to improving existing products or developing new products. They help the business stay competitive and enable the company to launch new products in the future. Not all businesses will have this R&D expense. Hotels and restaurants, for example, won’t have R&D expense. R&D is more common among science and technology-based companies.
Selling, General and Administrative (SG&A)
SG&A are expenses the company incur to (1) create demand for the business and (2) administer the business. The former is mostly sales and marketing expenses. Costs the company incurred to convince customers to buy its products. It includes items such as advertising fees, marketing team wages, sales commissions, public relations, etc. The latter is mostly expenses to administrate the company. It includes things like corporate office rent and payroll for the corporate staff, such as management, legal, finance, HR, etc. Sometimes companies would break SG&A into two separate lines on the Income Statement. One for Sales & Marketing and another for General & Administrative. However, in many instances, companies lump them together and call it Selling, General and Administrative.
Operating Income
Operating Income represents the profit generated from running the business operations. It’s the difference between Revenue and all business operating expenses. Think of this as the profit a company earns just from running the business. It doesn’t include income from other sources, such as interest on the cash deposited in the bank. On the Income Statement, companies would often call this “Operating Income” or “Income from Operations” or “EBIT”.
Interest and Taxes
After recording the P&L for the business operations, the Income Statement accounts for income and expenses aside from the business. These mainly relate to interest income from cash deposited in the bank, and interest expense on debt borrowed. And then after accounting for interest, we subtract Income Taxes.
Net Income
Net Income is the bottom line on the Income Statement and represents the overall profit of the entire company. It adds up all the incomes (Revenue, interest income, other incomes) and subtracts all expenses (operating expenses, interest, taxes). This is the ultimate amount of profit that the company earned for shareholders during the period.
Weighted Average Shares Outstanding (WASO)
Weighted Average Shares Outstanding is the average number of shares the company has outstanding during the period. The number of shares outstanding changes over time because companies can issue additional shares or repurchase existing shares.
Earnings per Share (EPS)
Earnings per Share represents the Net Income the company has earned for each share. It represents the profit each share is entitled to. For this reason, it’s also known as “Net Income per Share”. We can calculate EPS simply by dividing the company’s Net Income by WASO. Whereas Net Income represents what the company earned in total, EPS represents what the company earned for each stock.
Are you starting to see the flow behind the Income Statement? It starts with Revenue. From here, it subtracts Cost of Goods Sold to get Gross Profit, which is the profit of the products sold. Then, it subtracts other operating expenses to get Operating Income. This is the profit of the entire business operations. Then, it accounts for other income and expenses outside of the business, like interest and taxes to calculate Net Income. And finally, it divides the Net Income by the Weighted Average Shares Outstanding to calculate Earnings per Share. What we have at the end is the total profit for all shareholders and the profit entitled to each share.
Income Statement Formula
Now that we know the common line items, let’s learn about the important Income Statement formulas. We’ll lay out the formulas we use to compute (1) certain line items and (2) ratios.
Gross Profit = Revenue – Cost of Goods Sold
Note that synonyms for Revenue is Sales. And synonyms for Cost of Goods Sold is Cost of Service, Cost of Revenue, and Cost of Sales. Different companies might label things differently, so you can still plug them into this formula. The greater the Gross Profit, the more money the company has left to pay for other operating expenses.
Operating Income = Revenue – All Operating Expenses
Most publicly-traded companies would explicitly calculate Operating Income on the Income Statement. The calculation is very simple. Simply subtract all of the company’s operating expenses from Revenue and that’s the Operating Income. The greater the operating income means the more profitable the company’s business is.
Net Income = Operating Income + Interest Income – Interest Expense – Taxes
To calculate Net Income, we can start with Operating Income, add Interest Income, and subtract Interest Expense and Income Taxes. Alternatively, we can start with Revenue, add other sources of income and subtract all expenses.
Earnings per Share = Net Income / Weighted Average Shares Outstanding
EPS can be calculated by dividing Net Income by WASO. EPS is probably one of the most important line items for a public company. How much EPS a company generates directly affects its stock price.
Growth Rate = (Current Year Metric / Prior Year Metric) – 1
We use growth rates to analyze the company’s performance trajectory. Healthy businesses grow over time. All else equal, it’s far better to invest in a growing business than a declining business. Similarly, the greater the growth rate, the better. Analysts usually calculate growth rates on Revenue and profit metrics.
As an example, suppose a company generated $500 of Revenue in Year 1 and $700 in Year 2. Then the growth rate from Year 1 to Year 2 is ($700 / $500) – 1, or 40%.
Profit Margin = Profit Metric / Revenue
We can calculate profit margin for all the profit metrics by dividing them by the matching Revenue. Divide Gross Profit by Revenue and we have Gross Margin. Similarly, divide Operating Income by Revenue and we have Operating Margin. Margins are usually presented in percentage format.
As an example, suppose a company generated $180 of Operating Income on $500 of Revenue in Year 1. This means it has an Operating Margin of ($180 / $500), or 36%.
Income Statement Limitations
While the Income Statement can tell us a lot about the company’s profitability, it has 2 major limitations. It doesn’t measure cash flow and it doesn’t paint the full picture of the company’s earnings power.
Does Not Measure Cash Flow:
Revenue and expenses on the Income Statement are recorded on an accrual basis. Recall that we learned about the Accrual Principle and Matching Principle earlier in this article.
Revenue is recognized when goods and services are delivered to customers. Notice that Revenue is not recognized based on when cash is received, but based on when products are provided. For many large businesses, cash is rarely received at the exact same time when goods and services are delivered. Similarly, expense is recognized based on when they are incurred and matched with the corresponding revenue. It’s not recorded based on when they are paid for with cash. That’s why there’re accounts receivables and accounts payables.
Because the Income Statement doesn’t track when cash is received or paid, it doesn’t measure cash flow. Ultimately, the value of a company is based on how much cash flow it’ll generate. For that, we have to turn to the Cash Flow Statement.
Does Not Paint the Full Picture of Earnings Power:
The Income Statement under US GAAP records all income and expenses incurred, regardless of circumstances. This could create a misleading representation of the company’s true earnings power. For example, an Income Statement might show a significant increase in Revenue and profits relative to the prior year. This would give the impression that the business is on a great trajectory. However, this increase could be due to a recent acquisition as opposed to natural organic growth. It’s up to analysts to dissect the numbers and understand the story behind the numbers. Another common issue is that companies could’ve incurred certain one-time expenses. These expenses might’ve been incurred due to unusual events that won’t occur again. As a result, these non-recurring expenses could make the company’s earnings lower than what it’s normally capable of.
Because of these limitations, analysts can’t rely their opinion of a company solely based on the Income Statement. We have to evaluate the company in conjunction with the Cash Flow Statement and the Balance Sheet. We should also make manual adjustments to the GAAP metrics to assess the true underlying earnings power of the business.
Non-GAAP Adjustments
To overcome the limitations of the Income Statement under GAAP, analysts often make adjustments to the earnings metrics. These adjustments are outside of GAAP, so they’re called non-GAAP adjustments. We’ll talk about non-GAAP adjustments in greater detail in a separate article.