What is a Balance Sheet?
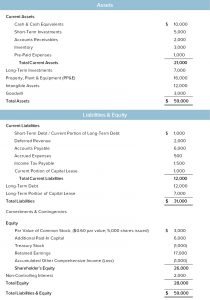
The Balance Sheet is one of the three main financial statements that we use to analyze a company. It shows a company’s assets (what the company owns), liabilities (what it owes), and equity (value left over for the company owners) as of a specific point in time. The Balance Sheet as a financial report that tells you the company’s net worth at a specific point in time. Logically, a company is made up of all the assets it owns and liabilities it owes. Therefore, the Balance Sheet is a critical component in financial analysis. All of the high paying finance jobs require a solid understanding of the Balance Sheet. Here’s what a Balance Sheet looks like:
Through this article, we’ll develop a strong understanding of Balance Sheet. First, we’ll look at an example of a real Balance Sheet for a real company. Second, we’ll learn how the Balance Sheet is structured and the common line items. Third, we’ll learn the accounting principles that underpin the Balance Sheet. These accounting principles form the basis that determine the values on the Balance Sheet. And finally, we’ll learn about the key insights we can derive from a Balance Sheet. That is, what the Balance Sheet tells you about a company.
Balance Sheet Example
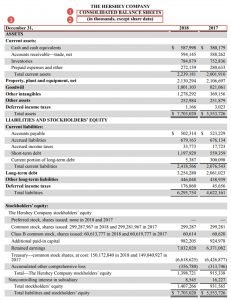
Here’s a real Balance Sheet for Hershey (NYSE: HSY), the maker of the famous Hershey’s chocolate. You can find the Balance Sheet on PDF page 57 of the company’s annual report.
There are a few things to note here.
First, notice that the Balance Sheet is explicitly labeled as “Consolidated” Balance Sheet. This is standard among American companies. Under US GAAP, companies have to report “consolidated” financial statements. To consolidate financials means to combine the financials from all the entities and subsidiaries that the company controls. So “Consolidated” Balance Sheet means the company is including everything that it controls in the financials.
Second, pay attention to the fact that companies clarify the unit metrics for the Balance Sheet at the top. In Hershey’s case, the company is reporting the Balance Sheet values in thousands. The implication is that all the numbers on this statement should be read in thousands. So for example, the value of “Cash and Cash Equivalents” is $587,998. This means it’s $587,998 thousand or $587 million and $998 thousand.
A common mistake among beginners is to read the numbers exactly as stated and neglect the unit metrics. Unit metrics is very common for financial statements of large companies, especially those that are publicly traded. This rounding guides analysts to focus on the important digits. It also makes the Balance Sheet much more appealing to read. Therefore, the first thing you should do anytime you analyze a Balance Sheet is to check the unit metrics. This will enable you to understand the true scale of the numbers.
And third, notice that the Balance Sheet pinpoints the exact date. This brings us to our third point about the Balance Sheet: the time period.
Balance Sheet Time Period
The Balance Sheet differs from the other financial statements in the time period on which it reports the values. Whereas the Income Statement and the Cash Flow Statement shows how the company has performed financially over a period of time, the Balance Sheet shows the financials at a specific point in time. The Income Statement and the Cash Flow Statement might show you the amount of money earned from 1/1 through 12/31. The Balance Sheet, however, will tell you how much assets and liabilities it has on 12/31. For this reason, some people refer to the Balance Sheet as a snapshot of the company’s financial position. That’s why the Balance Sheet is also known as the Statement of Financial Position.
The Balance Sheet enables us to understand the company’s latest financial position at the time we’re performing our analysis. Collectively, the financial statements are saying: given how much money the company made and how much money it spent over last year (Income Statement and Cash Flow Statement), here’s what the company owns and what it owes at the end (Balance Sheet).
The Balance Sheet Equation
The Balance Sheet is structured with three main sections: Assets, Liabilities, and Equity. On Balance Sheets, companies will show the Assets section first, Liabilities second and Equity last.
Assets = Liabilities + Equity
Conceptually, whatever value of assets is left after paying for the value of liabilities belongs to the owners. Therefore, Assets equals the sum of Liabilities and Equity. This is known as the Accounting Equation. The total value of Assets must be the same as the total value of Liabilities and Equity. The two numbers must be the same so that the Balance Sheet “balances”. The Balance Sheet is predicated on this Accounting Equation.
Balance Sheet Format
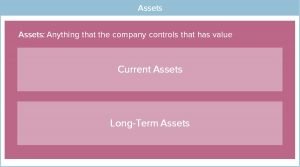
Within the Assets section, companies will further sub-categorize their various assets by Current Assets and Long-Term Assets. Current Assets are those that can be converted into cash within one year. Long-Term Assets are those that cannot be converted into cash within one year. The ability to convert assets into cash is known as liquidity. The items in the Assets section are ordered based on decreasing liquidity. In other words, the assets that can be most easily converted into cash are listed first. Those that are most difficult to convert into cash are listed last. Naturally, items in the Current Assets section are ordered before Long-Term Assets.
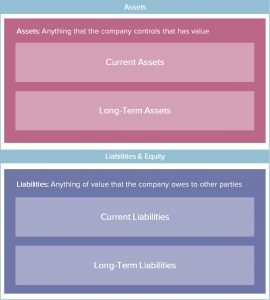
Similar to the Assets section, companies will also further sub-categorize what they owe by Current Liabilities and Long-Term Liabilities. Current Liabilities are those that require cash payments within one year. Long-Term Liabilities are those that do not require cash payments within one year. Current Liabilities are ordered before Long-Term Liabilities.
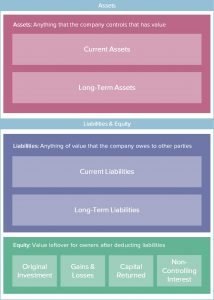
The Equity section starts with how much money the owners had originally invested into the company. It also includes the gains and losses on those money invested. Then it adjusts for the money investors had gotten back from the company. And lastly, it includes Non-Controlling Interest.
While companies will have minor differences in formatting and labeling, this overall structure is standard across companies. The Assets section comes first, followed by Liabilities and Equity. Within Assets section, items are ordered based on liquidity and sub-categorized into Current Assets and Long-Term Assets. Within Liabilities, items are ordered based on usage of cash and sub-categorized into Current Liabilities and Long-Term Liabilities. Now that we understand how the Balance Sheet is structured, let’s learn about the common line items.
Assets
Conceptually, an asset is anything that the company controls that has value, anything that benefits the company. The common assets that a company has are:
Cash & Cash Equivalents
This is the value of cash the company has on hand. The cash it has in the cash registers, the cash in the bank accounts, CDs, etc. Nothing is more liquid than cash. Therefore, Cash & Cash Equivalents is usually the first line on the Balance Sheet.
Short-Term Investments
This is the value of investments that can be easily sold and converted into cash within a year. They’re usually publicly-traded securities, such as stocks and bonds, that can be easily liquidated.
Accounts Receivable
This is the value of money that the company has yet to collect on goods and services already delivered. Said differently, this is the value of money that customers owe the company but not yet paid.
Long-Term Investments
Long-Term Investments are investments the company has made that cannot be sold and converted into cash within one year. They’re usually investments in privately-held companies. These investments can’t be liquidated without an extended sale process.
Property, Plant & Equipment (PP&E)
Property, Plant & Equipment (PP&E) relate to physical assets the company controls other than its inventory. PP&E includes things like land, factory buildings, machines, computers, desks, chairs, refrigerators, keyboards, telephones, shopping carts, trucks, etc.
Intangible Assets
Intangible Assets are assets that the company controls without a physical substance. Examples are brand, copyrights, patents, licenses, customer relationships, and trade secrets.
There are many other types of assets a company can have, but these are probably the most common ones. Now that we know the common assets a company may have, let’s learn about the common liabilities.
Liabilities
Conceptually, a liability is anything that has value that the company owes to other parties. The common liabilities that a company has are:
Current Portion of Long-Term Debt
This is the amount of money the company owes to lenders that has to be repaid within the year. The company may have borrowed a lot more, but only has to repay a portion of it within one year. Therefore, it’s called “Current Portion” of Long-Term Debt.
Accounts Payable
Accounts Payable represents the value of money the company owes to suppliers and other vendors for goods and services provided. Said differently, the company had purchased things from other companies but not yet paid for them.
Deferred Revenue
Deferred Revenue is the value of goods and services that the company owes to its customers. The customers have already paid the company in advance but the company has not yet delivered what the customers purchased.
Long-Term Debt
Long-Term Debt is the portion of the company’s total borrowings that isn’t due to be repaid within one year. They’ll eventually have to be repaid, just not within the next 12 months.
Capital Lease
Capital Lease represents the present value of future lease payments that the company has to make. It’s the money companies has to pay for whatever asset (i.e. office space, factory building, etc.) the company is leasing.
Commitments & Contingencies
Commitments are obligations of the company to perform something in the future. Example: Company signed a contract to buy $100 million of goods from a supplier. Contingencies are possible obligations that can take place based on uncertain future events. Example: Company is being sued for $20 million and the lawsuit is still pending.
Most companies will have other types of Current Liabilities. We go over detailed list of Current Liabilities in our online courses. Next, let’s go over the common line items that appear under the Equity section.
Equity
Conceptually, the Equity section shows (1) how much money the company’s owners had originally invested into the company, (2) how much gains and losses the company has made for the owners, (3) how much money the company had given back to the owners, and (4) Non-Controlling Interest. Here are the common line items:
Common Stock (Par Value) and Additional Paid-In Capital (APIC).
This is the amount of capital equity holders had invested into the company. Of the total investment, the bare minimum is recorded in Common Stock. Anything in excess of par is included in Additional Paid-In Capital.
Retained Earnings
Retained Earnings is the cumulative profit the company has earned for shareholders that hasn’t been paid through dividends yet. Said differently, Retained Earnings is the company’s cumulative profit that has not yet been distributed to the owners.
Accumulated Other Comprehensive Income (AOCI)
AOCI is the cumulative unrealized gains or losses that the company has earned from investments or other assets. The company has seen the value of its investments increase, but it hasn’t sold them yet. So the gains and losses aren’t realized yet.
Treasury Stock
On the Balance Sheet, this represents the value of money the company had spent to repurchase its stocks. It shows the amount of money the company had given back to the equity holders.
Non-Controlling Interest (NCI)
Non-Controlling Interest represents the value of Assets leftover after Liabilities that is NOT owned by the owners of the company. It’s previously known as Minority Interest.
Shareholder’s Equity
Shareholder’s Equity is the value of the assets the company controls leftover to company’s owners after covering all liabilities. It’s also known as the Book Value of Equity or simply Book Value.
For most companies, those are the only line items they’ll have. In fact, some might have less (i.e. many companies don’t have Non-Controlling Interest).
Balance Sheet Accounting Principles
We learned how the Balance Sheet is structured and the most common line items that appear on it. It’s time to learn about the key accounting principles that underpin the Balance Sheet. These accounting principles form the basis on which the values on the Balance Sheet are recorded. They standardize how companies determine the value of what they own and what they owe.

Monetary Unit Principle:
The first principle underpinning the Balance Sheet is the Monetary Unit Principle. It states that only accounts that can be measured in monetary units can be recorded in the company’s financial statements. If something can’t be measured with money, it can’t be recorded on the Balance Sheet.
Stable Dollar Assumption:
The Stable Dollar Assumption is a premise that the currency used to prepare the financial statements is stable over time. It assumes no impact from inflation or deflation on the currency. Said differently, it assumes that the dollar today has same purchasing power as the dollar 20, 40 years ago.
Cost Principle:
The Cost Principle requires Assets, Liabilities and Equity items on the Balance Sheet to be recorded at their historical cost. Historical cost is defined as the value of money paid or received at the time of transaction (“cost basis”). Financial accounting builds in this aspect of conservatism.
For example, companies often sell their products at a higher price than their cost. However, accountants have to record their values based on historical cost as opposed to what they can sell for. In other words, the value of inventory is based on how much it cost the company to produce these inventory. It’s not based on the value these inventory can sell for. Another example is real estate. A company could have purchased a piece of land 40 years ago that’s worth ten times as much today. However, despite the higher valuation in today’s market, the company would have to record the value of land at cost. It has to record the value of the land based on how much it originally cost to acquire the land. Cost Principle instills an aspect of conservatism into financial statements.
Matching Principle:
The Matching Principle requires revenues and any related expenses be recognized together (“matched”) in the same reporting period. Certain expenses will reduce the value of Assets. For example, recognized Depreciation Expense will reduce the value of PP&E. Bad Debt Expense will reduce the value of Accounts Receivables. Goodwill Impairment will reduce the value of Goodwill. The value of Assets are reduced by associated expenses when they are recognized under the Matching Principle.
Lower of Cost and Market:
Businesses are required to regularly assess the Fair Market Value (“FMV”) of their assets. FMV is what their assets can be sold for in today’s market. Under US accounting rules, companies have to record the lower of historical cost and Fair Market Value. Nothing is done if the FMV is greater than the value of the asset recorded on the Balance Sheet. However, companies have to mark down the value if the FMV is lower than cost.
Continuing with the previous example where a company had purchased a piece of land 40 years ago. If the land is worth more today than what the company had paid for, nothing changes. The company continues to record the land based on historical cost. But if the land is worth less today than original cost, then it’ll have to reduce the value. The company will have to record it at the Fair Market Value because it’s lower than historical cost. This is another aspect of conservatism built into accounting to prevent artificially inflating any company’s value.
Balance Sheet for Investing
By this point of this article, you should now understand what a Balance Sheet is. You should also know what it looks like, its structure, the common line items, and the underlying accounting principles. Naturally, the million-dollar question becomes: so what? What does the Balance Sheet tell you about a company? How can you derive insights from the Balance Sheet for investing?
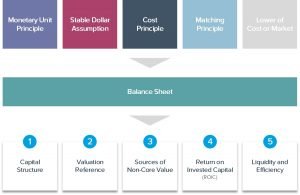
In short, the Balance Sheet tells you (1) the company’s capital structure, (2) its floor valuation, (3) whether it has any significant assets other than the core business operations, (4) whether the core business is earning a good return and (5) whether it has enough liquidity.
Capital Structure
The Balance Sheet tells us what the company’s capital structure looks like. It’s where we find out how much cash, investments and debt the company has. These are important numbers that we need to bridge between Equity Value and Enterprise Value. If you don’t know how capital structure affects a company’s valuation, you should check out our curriculum on Corporate Valuation. Calculating Equity Value and Enterprise Value is an important step in investment analysis.
Balance Sheet as Valuation Reference
An easy check on valuation is to compare the value of Shareholder’s Equity with Equity Value (aka “Market Capitalization”). For most companies outside of the financial services industry, Shareholder’s Equity is much lower than Equity Value. Therefore, Shareholder’s Equity establishes the floor valuation for the company. If Shareholder’s Equity is somehow higher than Equity Value, it could indicate that there’s something going on with the company. For companies in the financial services industry, such as banks and insurers, Shareholder’s Equity serves as an important valuation metric.
Sources of Non-Core Value
The Balance Sheet tells us whether the company owns any significant investments. Investments are important sources of value separate from the core business, which is measured by Enterprise Value.
This non-core value is often captured in “Long-Term Investments” or “Investments in Equity Interests”. A real-life example is Yahoo. About a decade ago, Yahoo owned not only its core business (yahoo.com) but also 44% of Alibaba. Yahoo captures its stake in Alibaba in the Investments line on its Balance Sheet under Long-Term Assets. 44% of Alibaba is worth +$200 billion today, but Yahoo’s Balance Sheet only recorded it at $2 billion. At the time, the stock market had priced Yahoo’s stock based only on its core business operations: yahoo.com. This means investors that bought Yahoo stock not only received a stake in yahoo.com but also a piece of Alibaba. They were able to get yahoo.com and a piece of the 44% Alibaba stake for the price of just yahoo.com! Yahoo disclosed information regarding the details of the Alibaba stake in footnotes to the Balance Sheet.
Return on Invested Capital (ROIC)
The Balance Sheet tells us whether the company’s core business operations is earning a good enough return on its investments. Said differently, it tells us whether the company is earning enough money given how much it had to spend. The return a company earns from its business usually go hand-in-hand with the returns investors earn on their investment. In particular, investors want to look for businesses that are earning a ROIC above WACC.
Liquidity and Efficiency
We can calculate Balance Sheet ratios to analyze the company’s liquidity and efficiency. Current Ratio, Quick Ratio and Net Debt (Cash) show whether the company has enough cash to cover its needs. We can also calculate various ratios such as Inventory Turnover, Days Receivable, Days Payable, etc. These ratios partially reflect how efficiently a company is running the various aspects of its business. Frankly, this usually isn’t a significant component of investment thesis. However, it could potentially play a role in an activist investing thesis. Activist investors can push management to improve upon inefficiencies, which will enhance the company’s ability to generate cash flow.
If you know where to look, you can find out a lot about the company from analyzing its Balance Sheet. We’ll go over this in more depth in our courses.